Product
Announcing Socket Fix 2.0
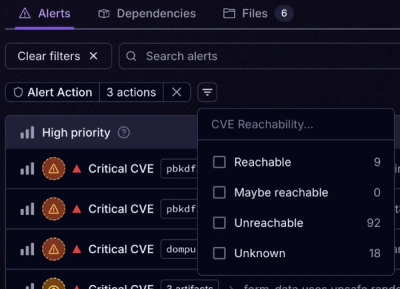
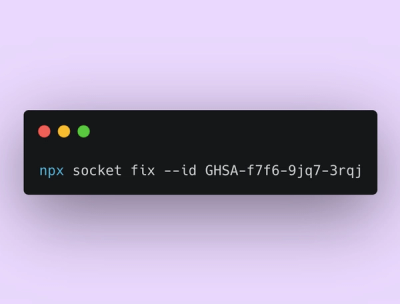
Socket Fix 2.0 brings targeted CVE remediation, smarter upgrade planning, and broader ecosystem support to help developers get to zero alerts.
By Martin Torp, John-David Dalton, Jeppe Fredsgaard Blaabjerg, Benjamin Barslev, Oskar Haarklou Veileborg - Sep 10, 2025