Product
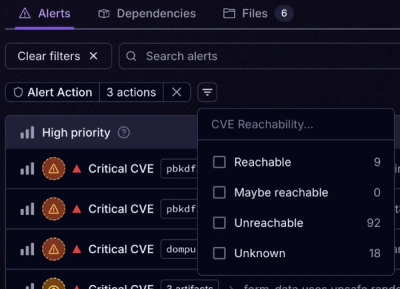
Introducing Tier 1 Reachability: Precision CVE Triage for Enterprise Teams
Socket’s new Tier 1 Reachability filters out up to 80% of irrelevant CVEs, so security teams can focus on the vulnerabilities that matter.
atatus-node
Advanced tools
Atatus Node.js agent allows you to monitor your Node.js application performance and captures errors in real-time.
Create a free account to start monitoring your Node.js apps.
Install atatus-node using npm:
npm install --save atatus-node
Require atatus-node in your node.js app:
var atatus = require("atatus-node");
Start the atatus agent with your API key:
atatus.start({ apiKey: "YOUR_API_KEY" });
See below for additional configuration options.
The atatus.start can accept other options along with API Key. The options can be a combination of any of the following:
If you use an appVersion to identify releases of your app you can send it to Atatus. It is highly recommended to set App Version.
// From your app Package.json
atatus.start({ apiKey: "YOUR_API_KEY", appVersion: require('./package.json').version });


// OR

// You can also directly assign it
atatus.start({ apiKey: "YOUR_API_KEY", appVersion: "1.0.0" });
By default, Atatus looks at the NODE_ENV environment variable to see what releaseStage the script is running in. If that is not set, Atatus assumes you are running in production. If you want to override this behavior, you can set the releaseStage option:
atatus.start({ apiKey: "YOUR_API_KEY", releaseStage: "development" });
Atatus can highlight stacktrace lines that are in your project, and automatically hides stacktrace lines from external libraries. If Atatus is not hiding external stacktrace lines, it is likely that the projectRoot is being incorrectly calculated. You can set projectRoot as part of the register call:
atatus.start({ apiKey: "YOUR_API_KEY", projectRoot: "/path/to/root" });
It is often very useful to send some extra info along with errors and performance metrics, so that you can filter them in the Atatus UI. To do this, you can set the tags:
atatus.start({ apiKey: "YOUR_API_KEY", tags: ['new-user', 'signup'] });
To debug error effectively, you can also send some meta data along with errors. To do this, you can set the customData:
atatus.start({ apiKey: "YOUR_API_KEY", customData: { foo: 'bar', name: "John Doe" }});
You can use a proxy server by configuring a proxy url when registering with atatus.
atatus.start({ apiKey: "YOUR_API_KEY", proxy: "http://localhost:8080" });
By default we'll fetch the hostname using Node's os.hostname(), but you can override this as follows:
atatus.start({ apiKey: "YOUR_API_KEY", hostname: "web1.example.com" });
If you want to modify error reports just before they are sent to Atatus, or prevent them from being sent, you can add before notify callbacks:
Atatus.beforeErrorSend(function (payload) {

    var errorMessage = payload.exceptions[0].message;

    // Dont send Not found message
    if (errorMessage.indexOf('Not Found') === 0) {
        return false;
    }

    return true;
});
If you want to send code snippets for each frame of the stacktrace you can enable sendCode. This asynchronously loads any file from the stacktrace, which is within the scope of the project, and sends 3 lines either side of the erroneous line of code to Atatus.
This works almost the same as how Atatus JavaScript projects handle sourcemaps - however loading the code is done on the local machine and sent over the internet with the error data. By default, this option is enabled. If you don't want, you can disable it.
atatus.start({ apiKey: "YOUR_API_KEY", sendCode: false });
If you need programmatical control over how the errors are grouped within atatus, you can send a groupingKey to the notify call. This will ensure that atatus groups all errors with the same groupingKey together.
atatus.start({ apiKey: "YOUR_API_KEY", groupingKey: function(payload) {
        // You can generate grouping based on error payload details or send static grouping key for all errors
        return "auth/create";
    }
});
Atatus automatically captures exceptions and HTTP errors from your Node.js app. If you want to send error manually, you can do it by atatus.notifyError function. The accepts an error as either a string or an Error object as the first argument, as well as options object as its second parameter. The second parameter may contain tags, custom data and user id.
atatus.notifyError(new Error("Something went badly wrong"), { tags: ['new-user', 'signup'], customData: { name: 'John Doe', country: 'US' } });
A unique identifier for a user affected by this error. This could be any distinct identifier that makes sense for your application. In Express/Connect apps, this is automatically set to the ip address of the current request.
atatus.notifyError(new Error("Something went badly wrong"), { userId: "someone@example.com" });
FAQs
The official Atatus agent for Node.js
We found that atatus-node demonstrated a not healthy version release cadence and project activity because the last version was released a year ago. It has 1 open source maintainer collaborating on the project.
Did you know?

Socket for GitHub automatically highlights issues in each pull request and monitors the health of all your open source dependencies. Discover the contents of your packages and block harmful activity before you install or update your dependencies.

Product
Socket’s new Tier 1 Reachability filters out up to 80% of irrelevant CVEs, so security teams can focus on the vulnerabilities that matter.

Research
/Security News
Ongoing npm supply chain attack spreads to DuckDB: multiple packages compromised with the same wallet-drainer malware.

Security News
The MCP Steering Committee has launched the official MCP Registry in preview, a central hub for discovering and publishing MCP servers.