D3 Calendar Heatmap Mini
This code was originally forked from https://github.com/DKirwan/calendar-heatmap and modified. This
serves to publish the package to npm as calendar-heatmap-mini along with a few key differences.
Key Differences
- Option for
singleSelection thanks to @remyvhw. npm installable as well as importable as a module.- Update to the latest
d3@4.8.0
- Trim down to specific
d3 packages.
- Data is auto initialized if none is presented.
- When updating the same instance of a heatmap, previous
max size is not used. - Use SVG
text for tooltips. - Move into a non-forked version of the repository.
- Rework project structure into the appropriate name (
calendar-heatmap-mini).
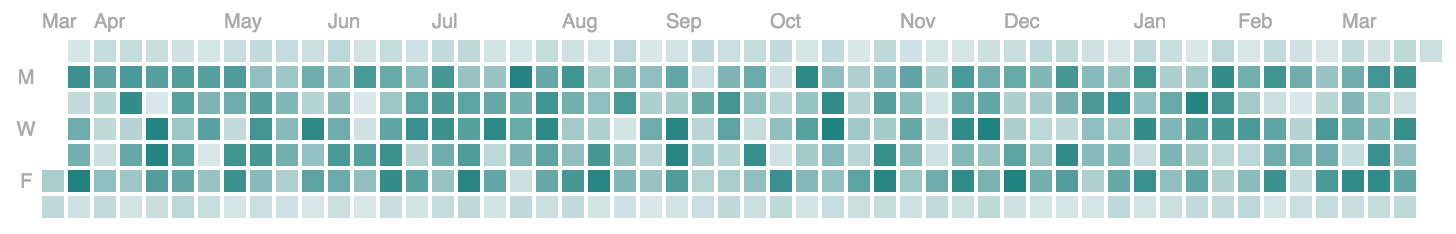
A d3.js heatmap representing time series data. Inspired by Github's contribution chart.
Configuration
| Property | Usage | Default | Required |
|---|
| data | Chart data | none | no |
| selector | DOM selector to attach the chart to | body | no |
| max | Maximum count | max found in data | no |
| startDate | Date to start heatmap at | 1 year ago | no |
| colorRange | Minimum and maximum chart gradient colors | ['#D8E6E7', '#218380'] | no |
| tooltipEnabled | Option to render a tooltip | true | no |
| tooltipUnit | Unit to render on the tooltip, can be object for pluralization control | 'contributions' | no |
| legendEnabled | Option to render a legend | true | no |
| onClick | callback function on day click events (see example below) | null | no |
| singleSelection | Option to only be able to select a single date | false | no |
| locale | Object to translate every word used, except for tooltipUnit | see below | no |
Default locale object
{
    months: ['Jan', 'Feb', 'Mar', 'Apr', 'May', 'Jun', 'Jul', 'Aug', 'Sep', 'Oct', 'Nov', 'Dec'],
    days: ['S', 'M', 'T', 'W', 'T', 'F', 'S'],
    No: 'No',
    on: 'on',
    Less: 'Less',
    More: 'More'
}
Dependencies
Usage
Without npm
1: Add d3.js and moment.js
2: Include calendar-heatmap-mini.js and calendar-heatmap-mini.css.
<link rel="stylesheet" type="text/css" href="path/tocalendar-heatmap-mini.css">
<script src="path/to/calendar-heatmap-mini.js"></script>
3: Format the data so each array item has a date and count property.
As long as new Date() can parse the date string it's ok. Note - there all data should be rolled up into daily bucket granularity.
4: Configure the chart and render it
var chartData = [{
date: new Date(),
count: 100
}];
var chart1 = calendarHeatmap()
.data(chartData)
.selector('#chart-one')
.colorRange(['#D8E6E7', '#218380'])
.tooltipEnabled(true)
.onClick(function (data) {
console.log('onClick callback. Data:', data);
});
chart1();
With npm
1: Add package dependency.
npm install calendar-heatmap-mini --save
- Import however desired.
import CalendarHeatMap from 'calendar-heatmap-mini'
- Configure and render the chart.
import CalendarHeatMap from 'calendar-heatmap-mini'
var chartData = [{
date: new Date(),
count: 100
}];
const chart1 = new CalendarHeatMap()
.data(chartData)
.selector('#chart-one')
.colorRange(['#D8E6E7', '#218380'])
.tooltipEnabled(true)
.onClick(function (data) {
console.log('onClick callback. Data:', data);
});
chart1();
Control Unit Pluralization
var chart1 = calendarHeatmap()
.data(chartData)
.tooltipUnit(
[
{min: 0, unit: 'contribution'},
{min: 1, max: 1, unit: 'contribution'},
{min: 2, max: 'Infinity', unit: 'contributions'}
]
);
chart1();
Pull Requests and Issues
...are very welcome!


