Product
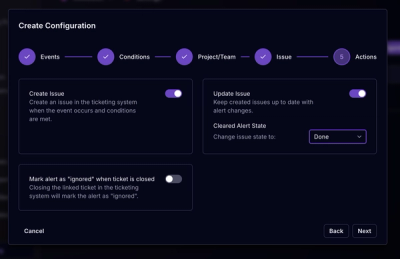
Socket for Jira Is Now Available
Socket for Jira lets teams turn alerts into Jira tickets with manual creation, automated ticketing rules, and two-way sync.
By Jeppe Hasseriis - Apr 20, 2026
chartjs-node-canvas
Advanced tools
![]()
![]()

A Node JS renderer for Chart.js using canvas.
Provides and alternative to chartjs-node that does not require jsdom (or the global variables that this requires) and allows chartJS as a peer dependency, so you can manage its version yourself.
npm i chartjs-node-canvas chart.js
This is limited by the upstream dependency canvas.
See the GitHub Actions yml section for the current supported Node version(s). You will need to do a npm rebuild to rebuild the canvas binaries.
Currently supports 4.x.x. You are given the ability to maintain the version yourself via peer dependency, but be aware that going above the specified version might result in errors.
ChartJSNodeCanvas, so you can mutate the ChartJS global variable separately within each instance.I hope to convert this package to a node module in the future, but since it uses the CommonJS API to manage memory for ChartJS this is not a simple task. It it a top priority for the next major release.
Chart animation (and responsive resize) is disabled by this library. This is necessary since the animation API's required are not available in Node JS/canvas-node (this is not a browser environment after all).
This is the same as:
Chart.defaults.animation = false;
Chart.defaults.responsive = false;
*Note this is WIP, see the change log for most recent development.
For some unknown reason canvas requires use of the sync API's to use SVG's or PDF's. This libraries which support these are:
You also need to set the canvas type when you initialize the ChartJSNodeCanvas instance like the following:
const { ChartJSNodeCanvas } = require('chartjs-node-canvas');

const chartJSNodeCanvas = new ChartJSNodeCanvas({ type: 'svg', width: 800, height: 600 });
See the API docs.
const { ChartJSNodeCanvas } = require('chartjs-node-canvas');

const width = 400; //px
const height = 400; //px
const backgroundColour = 'white'; // Uses https://www.w3schools.com/tags/canvas_fillstyle.asp
const chartJSNodeCanvas = new ChartJSNodeCanvas({ width, height, backgroundColour});

(async () => {
    const configuration = {
        ... // See https://www.chartjs.org/docs/latest/configuration
    };
    const image = await chartJSNodeCanvas.renderToBuffer(configuration);
    const dataUrl = await chartJSNodeCanvas.renderToDataURL(configuration);
    const stream = chartJSNodeCanvas.renderToStream(configuration);
})();
Also see the example and the generated image.
Every instance of ChartJSNodeCanvas creates its own canvas. To ensure efficient memory and GC use make sure your implementation creates as few instances as possible and reuses them:
// Re-use one service, or as many as you need for different canvas size requirements
const smallChartJSNodeCanvas = new ChartJSNodeCanvas({ width: 400, height: 400 });
const bigCChartJSNodeCanvas = new ChartJSNodeCanvas({ width: 2000, height: 2000 });

// Expose just the 'render' methods to downstream code so they don't have to worry about life-cycle management.
exports = {
    renderSmallChart: (configuration) => smallChartJSNodeCanvas.renderToBuffer(configuration),
    renderBigChart: (configuration) => bigCChartJSNodeCanvas.renderToBuffer(configuration)
};
Just use the ChartJS reference in the callback:
const chartJSNodeCanvas = new ChartJSNodeCanvas({ width, height, chartCallback: (ChartJS) => {
    // New chart type example: https://www.chartjs.org/docs/latest/developers/charts.html
    class MyType extends Chart.DatasetController {

    }

    Chart.register(MyType);
    }
});
Just use the ChartJS reference in the callback:
const chartJSNodeCanvas = new ChartJSNodeCanvas({ width, height, chartCallback: (ChartJS) => {
    // Global config example: https://www.chartjs.org/docs/latest/configuration/
    ChartJS.defaults.elements.line.borderWidth = 2;
} });
Just use the registerFont method:
const chartJSNodeCanvas = new ChartJSNodeCanvas({ width, height, chartCallback: (ChartJS) => {
    // Just example usage
    ChartJS.global.defaultFontFamily = 'VTKS UNAMOUR';
} });
// Register before rendering any charts
chartJSNodeCanvas.registerFont('./testData/VTKS UNAMOUR.ttf', { family: 'VTKS UNAMOUR' });
See the node-canvas docs and the chart js docs.
On windows you need to install the font first, before running your app. Otherwise you will get an error something like:
Pango-WARNING **: 11:13:09.211: couldn't load font "vtks unamour Not-Rotated 12px", falling back to "Sans Not-Rotated 12px", expect ugly output.
See here.
Due to the many issues and question this includes a convenience plugin to fill the otherwise transparent background. It uses the fillStyle canvas API;
const chartJSNodeCanvas = new ChartJSNodeCanvas({ width, height, backgroundColour: 'purple' });
This library is designed to make loading plugins as simple as possible. For legacy plugins, you should just be able to add the module name to the appropriate array option and the library handles the rest.
The Chart.JS plugin API has changed over time and this requires compatibility options for the different ways plugins have been historically loaded. ChartJS Node Canvas has a plugin option with specifiers for the different ways supported plugin loading methods are handled. If you are not sure about your plugin, just try the different ones until your plugin loads:
Let ChartJSNodeCanvas manage the lifecycle of the plugin itself, each instance will have a separate instance of the plugin:
const chartJSNodeCanvas = new ChartJSNodeCanvas({ width, height, plugins: {
    modern: ['chartjs-plugin-annotation']
} });
You want to share the plugin instance, this may cause unwanted issues, use at own risk:
const chartJSNodeCanvas = new ChartJSNodeCanvas({ width, height, plugins: {
    modern: [require('chartjs-plugin-annotation')]
} });
const chartJSNodeCanvas = new ChartJSNodeCanvas({ width, height, plugins: {
    requireChartJSLegacy: ['<some plugin>']
}});
require ChartJS themselves.const chartJSNodeCanvas = new ChartJSNodeCanvas({ width, height, plugins: {
globalVariableLegacy: ['chartjs-plugin-crosshair']
} });
const chartJSNodeCanvas = new ChartJSNodeCanvas({ width, height, plugins: {
    requireLegacy: ['chartjs-plugin-datalabels']
} });
These approaches can be combined also:
const chartJSNodeCanvas = new ChartJSNodeCanvas({ width, height, plugins: {
    modern: ['chartjs-plugin-annotation'],
    requireLegacy: ['chartjs-plugin-datalabels']
} });
See the tests for some examples.
There is a problem with persisting config objects between render calls, see this issue for details and workarounds.
@athombv at https://homey.app
FAQs
A node renderer for Chart.js using canvas.
The npm package chartjs-node-canvas receives a total of 148,704 weekly downloads. As such, chartjs-node-canvas popularity was classified as popular.
We found that chartjs-node-canvas demonstrated a not healthy version release cadence and project activity because the last version was released a year ago. It has 1 open source maintainer collaborating on the project.
Did you know?

Socket for GitHub automatically highlights issues in each pull request and monitors the health of all your open source dependencies. Discover the contents of your packages and block harmful activity before you install or update your dependencies.
Product
Socket for Jira lets teams turn alerts into Jira tickets with manual creation, automated ticketing rules, and two-way sync.

Company News
Socket won two 2026 Reppy Awards from RepVue, ranking in the top 5% of all sales orgs. AE Alexandra Lister shares what it's like to grow a sales career here.

Security News
NIST will stop enriching most CVEs under a new risk-based model, narrowing the NVD's scope as vulnerability submissions continue to surge.