Research
/Security News
Critical Vulnerability in NestJS Devtools: Localhost RCE via Sandbox Escape
A flawed sandbox in @nestjs/devtools-integration lets attackers run code on your machine via CSRF, leading to full Remote Code Execution (RCE).
chartjs-plugin-datalabels
Advanced tools
The chartjs-plugin-datalabels package is a plugin for Chart.js that allows you to display labels on data points in your charts. It provides a variety of customization options for positioning, styling, and formatting the labels, making it easier to enhance the readability and presentation of your data visualizations.
Basic Label Display
This feature allows you to display basic labels on your chart's data points. The labels are displayed in white color by default.
const chart = new Chart(ctx, {
type: 'bar',
data: data,
options: {
plugins: {
datalabels: {
display: true,
color: 'white'
}
}
}
});Custom Label Formatting
This feature allows you to customize the format of the labels. In this example, the labels are formatted to display a percentage sign after the value.
const chart = new Chart(ctx, {
  type: 'bar',
  data: data,
  options: {
    plugins: {
      datalabels: {
        formatter: function(value, context) {
          return value + '%';
        }
      }
    }
  }
});
Label Positioning
This feature allows you to control the positioning of the labels. In this example, the labels are anchored to the end of the data points and aligned to the top.
const chart = new Chart(ctx, {
  type: 'bar',
  data: data,
  options: {
    plugins: {
      datalabels: {
        anchor: 'end',
        align: 'top'
      }
    }
  }
});
Label Styling
This feature allows you to style the labels. In this example, the labels are styled with a blue color and a bold font of size 14.
const chart = new Chart(ctx, {
  type: 'bar',
  data: data,
  options: {
    plugins: {
      datalabels: {
        color: 'blue',
        font: {
          size: 14,
          weight: 'bold'
        }
      }
    }
  }
});The chartjs-plugin-annotation package allows you to draw lines and boxes on your Chart.js charts. While it focuses on annotations rather than data labels, it provides similar functionality in terms of enhancing the visual representation of your data.
The chartjs-plugin-labels package is another plugin for Chart.js that provides label display functionality. It offers similar features to chartjs-plugin-datalabels, such as label formatting and positioning, but may have different customization options and performance characteristics.
The chartjs-plugin-doughnutlabel package is specifically designed for adding labels to the center of doughnut charts in Chart.js. While it is more specialized than chartjs-plugin-datalabels, it provides similar functionality for a specific chart type.
Highly customizable Chart.js plugin that displays labels on data for any type of charts.
Requires Chart.js 3.x or higher.
You first need to install node dependencies (requires Node.js):
> npm install
The following commands will then be available from the repository root:
> npm run build            // build dist files
> npm run build:dev        // build and watch for changes
> npm run test             // run all tests and generate code coverage
> npm run test:dev         // run all tests and watch for changes
> npm run lint             // perform code linting
> npm run lint -- --fix    // automatically fix linting problems
> npm run docs             // generate documentation (`dist/docs`)
> npm run docs:dev         // generate documentation and watch for changes
chartjs-plugin-datalabels is available under the MIT license.
FAQs
Chart.js plugin to display labels on data elements
The npm package chartjs-plugin-datalabels receives a total of 613,898 weekly downloads. As such, chartjs-plugin-datalabels popularity was classified as popular.
We found that chartjs-plugin-datalabels demonstrated a not healthy version release cadence and project activity because the last version was released a year ago. It has 2 open source maintainers collaborating on the project.
Did you know?

Socket for GitHub automatically highlights issues in each pull request and monitors the health of all your open source dependencies. Discover the contents of your packages and block harmful activity before you install or update your dependencies.

Research
/Security News
A flawed sandbox in @nestjs/devtools-integration lets attackers run code on your machine via CSRF, leading to full Remote Code Execution (RCE).

Product
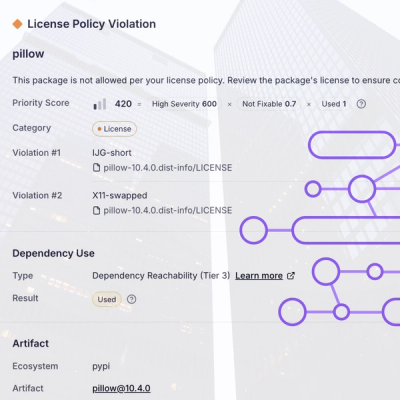
Customize license detection with Socket’s new license overlays: gain control, reduce noise, and handle edge cases with precision.

Product
Socket now supports Rust and Cargo, offering package search for all users and experimental SBOM generation for enterprise projects.