chronometrist
А tool to draw waterfall of timings in stdout of an Express nodejs application
I guess your Express application makes some async work before preparing a response to the user, and you might want to
see how long does some parts of that work take — especially, but not only, HTTP requests to your backends.
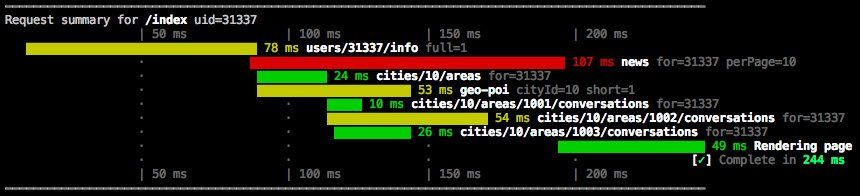
If you are a frontend developer, I guess you are familiar with "Waterfall" view on the "Network" pane
of Chrome's developer tools, and might want to have something similar here on your server. Here it is:
Usage
The library is maximally robust to fit any situation you need. At the moment 0 (from which you want to start timeline to flow)
you just create an instance, passing config and Express request and response objects to it:
const chronometrist = new Chronometrist({ enabled: true }, req, res);
It attaches a handler to request's end event and prints summary to console on request end.
Then, whan you want to measure a specific part of code, you just call in the beginning
const h = chronometrist.start('something', { some: params });
store a returned handler somewhere, and when this part reaches its end, call:
h.end();
or, if you think your part failed:
h.error(err);
Here you may pass an Error object, its message or statusCode property will be printed.
So, if you wrap your favorite server request library (got, asker, request etc.) with these .start and .end, you will essentially get a DevTools "Network" pane in your console.
Config options
All config fields are optional (but default values are such that summary won't show up at all).
enabled
Boolean, default: false
If false, Chronometrist does nothing. You actually want all this stuff as a debug output, so just enable Chronometrist in development environment
logThreshold
Number, default: 1000
Log only requests that took (between new Chronometrist() and request's end event) more milliseconds than this value. You might want to enable Chronometrist in production, but log only exccessively long requests to determine what makes them so long.
screenWidth
Number, default: 100
Number of characters to fit the whole timeline in. Timeline is always that wide, only the scale changes depending on how long did the request take.
redThreshold
Number, default: 500
Any operations that took more than this will be painted red
yellowThreshold
Number, default: 200
Any operations that took more than this will be painted yellow
totalRedThreshold
Number, default: 1000
If a whole request took more than this, a string "Comlete in XXX ms" will be printed in red. Note that if request returned a non-200 status code, this phrase will always be red
totalYellowThreshold
Number, default: 500
If a whole request took more than this, a string "Comlete in XXX ms" will be printed in yellow
shouldSkip()
function(req, res), default: () => false
You may add some custom logic here to extend enabled and logThreshold behavior. Just return true to prevent diagram from appearing. Function takes Express request and response as parameters
getOverallTitle()
function(req, res), default: req => req.path
A part of heading after "Request summary of...". Function takes Express request and response as parameters
getOverallInfo()
function(req, res), default: () => ''
Text that is shown after the title in gray. You might write here, for example, a request ID to simply find in your logs. Function takes Express request and response as parameters
filterQuery()
function(req, key, value), default: () => true
Params you pass to chronometrist.start as a second argument are filtered against this function. For example, you may add a bunch of specific query parameters to every request you issue. If you just wrap your HTTP library and pass query to start, you will have all of them show up in your diagram, which will break the layout. You may use filter to show only different and meaningful ones.
roundTo
Number, default: 1
Every millisecond value is rounded to this modulo. Actually, it was needed for tests to prevent them from flapping
log
function(string), default: console.log
Any function to call for printing result instead of console.log. You might want to store output in a file or send it somewhere instead of printing to stdout.
useColors
Boolean, default: true
When true, result is colored. When false, result is plain. When result is plain, yellowThreshold, redThreshold, totalYellowThreshold and totalRedThreshold obviously have no effect.