Product
Announcing Socket Fix 2.0
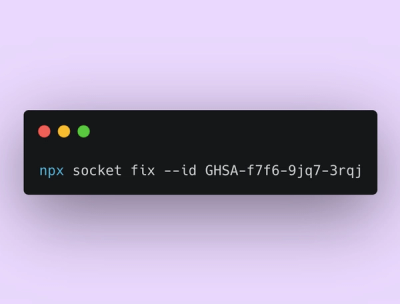
Socket Fix 2.0 brings targeted CVE remediation, smarter upgrade planning, and broader ecosystem support to help developers get to zero alerts.
console-pro-trace
Advanced tools
tarce your function. calc the case time.
when you have cluster process. you can use mter to split the log view.
// test/demo1.ts
import { console, registerClassDebug, IS_IN_TRACE_MODE } from '../src/';
class A {
async say(word) {
console.log(word)
}
}
registerClassDebug(A, 'A');
const a = new A();
a.say('qaq');
The log is not output by default. You need to configure environment variables:TRACE or CONSOLE_PRO_TRACE.
for example:
# in unix
TRACE='*' node your-app.js


# in windows cmd
set TRACE="*"
node your-app.js


# in windows powershell

$env:TRACE="*"
node your-app.js
now, run the demo1.ts:
TRACE=* ts-node test/demo1.ts

PS:the
consoleinstance is from console-pro.
TRACEregisterClassDebug(A, 'A');
registerClassDebug(B, 'B');
TRACE="A,B"
registerClassDebug(A, 'my/A');
registerClassDebug(B, 'my/B');
TRACE="my/*"
you can define static function getUnDebugMethodNames for class to skip debug some function.
class A {
    async say(word) {
        console.log(word)
    }
    private _dosomething(cb){
        setTimeout(cb, 1000)
    }
    static getUnDebugMethodNames(){
        return ["_dosomething"]
    }
}
import { console, registerInstanceDebug } from '../src/';
registerInstanceDebug({
    async say(word) {
        console.log(word)
    }
    _dosomething(cb){
        setTimeout(cb, 1000)
    }
    getUnDebugMethodNames(){
        return ["_dosomething"]
    }
}, 'my/simple/instance');
FAQs
tarce your function. calc the case time.
We found that console-pro-trace demonstrated a not healthy version release cadence and project activity because the last version was released a year ago. It has 1 open source maintainer collaborating on the project.
Did you know?

Socket for GitHub automatically highlights issues in each pull request and monitors the health of all your open source dependencies. Discover the contents of your packages and block harmful activity before you install or update your dependencies.

Product
Socket Fix 2.0 brings targeted CVE remediation, smarter upgrade planning, and broader ecosystem support to help developers get to zero alerts.

Security News
Socket CEO Feross Aboukhadijeh joins Risky Business Weekly to unpack recent npm phishing attacks, their limited impact, and the risks if attackers get smarter.

Product
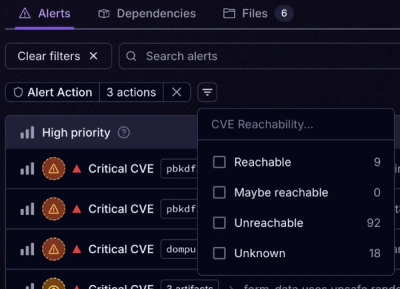
Socket’s new Tier 1 Reachability filters out up to 80% of irrelevant CVEs, so security teams can focus on the vulnerabilities that matter.