Product
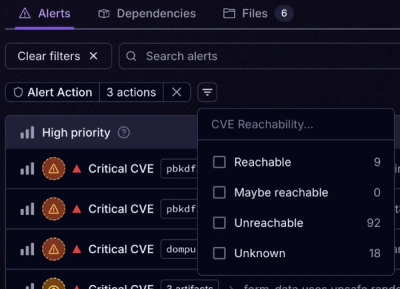
Introducing Tier 1 Reachability: Precision CVE Triage for Enterprise Teams
Socket’s new Tier 1 Reachability filters out up to 80% of irrelevant CVEs, so security teams can focus on the vulnerabilities that matter.
couchdb-stat-collector
Advanced tools
A CLI tool for collecting statistics about a CouchDB node or cluster.
This project is a work in progress. Its interface may change as new features are added.
You can get this tool via NPM:
$ npm i -g couchdb-stat-collector
Alternatively, binary releases are automatically uploaded to:
https://ams3.digitaloceanspaces.com/couchdb-stat-collector/couchdb-stat-collector-linux-x64
https://ams3.digitaloceanspaces.com/couchdb-stat-collector/couchdb-stat-collector-mac-x64
https://ams3.digitaloceanspaces.com/couchdb-stat-collector/couchdb-stat-collector-windows-x64.exe
Old versions are available at:
https://ams3.digitaloceanspaces.com/couchdb-stat-collector/archive/2.8.0/couchdb-stat-collector-linux-x64 etc.
Now the couchdb-stat-collector command should be on your $PATH. Try it like this:
$ couchdb-stat-collector http://admin:password@localhost:5984
Replace the first positional parameter with the URL for your CouchDB instance, including admin credentials. Alternatively, you can set the COUCH_URL environment variable with the correct URL.
Once completed, it should give you a success message like this:
$ couchdb-stat-collector
Investigation results zipped and saved to /path/to/${md5(COUCH_URL)}.json.gz
For more usage information, run couchdb-stat-collector --help.
You can tell the collector to send its investigation to an analyser service using an access token provided by the service. For example:
$ couchdb-stat-collector \
	--service \
	--service-url https://localhost:5001 \
	--service-token ...
Investigation results posted to https://localhost:5001/api/v1/collect
Now you will see this report on your service dashboard. We recommend you attach a command like this to cron or a similar program in order to investigate your CouchDB installation regularly, so that any issues can be identified and addressed proactively.
To protect values like your CouchDB credentials and analyser service access token, we recommend placing any configuration values for the collector into a config file. For example, consider this config.json:
{
  "couchUrl": "http://USERNAME:PASSWORD@localhost:5984",
  "service": "true",
  "service-url": "http://localhost:5001",
  "service-token": "..."
}
Then you can tell the collector to use this file, like this:
$ couchdb-stat-collector --config config.json
By setting the config file's permission settings, you can appropriately lock it down for use only by authorized parties. As CouchDB often runs under a couchdb user, we recommend placing this config file in that user's purview, setting its access permissions to 400, and then setting up a cronjob under that user to run regularly. Here is an example of how to do that:
$ su couchdb
$ cd
$ touch config.json
# then, edit the config file appropriately
$ chmod 400 config.json
Now you can create a cronjob from the couchdb user which uses that file. A cronjob that investigates your cluster hourly would look like this:
0 * * * * /PATH/TO/couchdb-stat-collector --config /PATH/TO/config.json
The collector uses a "task file" to conduct its investigation. By default, it uses tasks.json in the project's root directory. It is a JSON file containing an array where each element is an object representing a task for the collector to execute.
Tasks have these recognizes properties:
access: an object containing keys with jsonpath expressions. Task results are passed through these expressions and the results are mapped to the associated keys, for example: given the results of querying /_all_dbs, the access object { db: '$..*'} will result in [{ db: '_replicator' }, ...]. This is used to template route and name in sub-tasks.after: an array of other task objects to run after this one. Arguments parsed with access from the task's results are merged with the task's own arguments and passed to these sub-tasks.name: a friendly identifier for the task. Defaults to the task's route, and so is useful when that information may not reliably indicate the task's nature or purpose. Like route, this property is templated using handlebars.mode: an optional key that can be set to try in order to indicate that a task should be skipped if it fails. By default, a task that fails halts the investigation.query: an object whose properties are converted into a querystring and used in the task's request.route: a URL fragment indicating the path of the task's request. Like name, this property is templated using handlebars.save: a boolean flag for whether or not the result of a task should be saved. Useful for running tasks solely to populate their sub-tasks.version: a semver version identifier that is tested against a version argument (if it is present) which should be acquired by querying the cluster's root endpoint (/). There is an example of this in the test suite under "should do version checking".The keys name and route are templated using handlebars and the variables gathered by running a task result through the access filter plus any variables from parent tasks. The e helper encodes the parameter using encodeURIComponent so that database and document names can be properly mapped to a URL. In the example, the task which gathers a database's design documents uses the name {{e db}}/_design_docs to indicate that its nature, whereas the route is {{e db}}/_all_docs.
For more task examples, check the collector's default task file.
A collector's investigation will produce a gzipped JSON file containing an object with these keys:
date: A timestamp in milliseconds since the UNIX epoch for when the investigation occurred.host: The host that was investigated. For example: localhost:5984version: The version of the collector used in the investigationresults: Object containing all the results of the investigation.The results key contains an object keyed with all the results of the investigation. Each key corresponds to the name of some task that was run, for example: _all_dbs will contain the results of querying /_all_dbs, and $DB_NAME/_design_docs will contain the results of the route named $DB_NAME/_design_docs.
The object behind each of these keys comes directly from the result of the task's HTTP query, so for example _all_dbs might look like this:
{
	"_all_dbs": ["_replicator", ... ],
	...
}
The special _os key contains information about the system where the investigation was performed and includes data about system CPU, RAM, network, and disk. Here is an example output:
{
  "cpus": [
    {
      "model": "Intel(R) Core(TM) i7-7500U CPU @ 2.70GHz",
      "speed": 3174,
      "times": {
        "user": 2265800,
        "nice": 10800,
        "sys": 703400,
        "idle": 12098800,
        "irq": 0
      }
    },
    ...
  ],
  "disk": {
    "diskPath": "/",
    "free": 10341093376,
    "size": 110863347712
  },
  "network": {
    "lo": [
      {
        "address": "127.0.0.1",
        "netmask": "255.0.0.0",
        "family": "IPv4",
        "mac": "NO AWOO $350 PENALTY",
        "internal": true,
        "cidr": "127.0.0.1/8"
      },
      ...
    ],
    ...
  },
  "platform": "linux",
  "ram": {
    "free": 11225653248,
    "total": 16538009600
  },
  "release": "4.15.0-36-generic"
}
The NodeJS built-in library os is used to investigate the host system. Here are the methods used to populate the results object:
cpus: os.cpus()disk: check-disk-usagenetwork: os.networkInterfaces()platform: os.platform()ram: os.freemem() and os.totalmem()release: os.release()Get and build the tool locally with Git:
$ git clone neighbourhoodie/couchdb-stat-collector
$ cd couchdb-stat-collector
$ npm install
Now you can run the test suite like this:
$ npm test
You can run the tool like this:
$ npm start
Proprietary. Use only with permission of Neighbourhoodie Software GmbH.
FAQs
A stat collection tool for CouchDB.
We found that couchdb-stat-collector demonstrated a not healthy version release cadence and project activity because the last version was released a year ago. It has 2 open source maintainers collaborating on the project.
Did you know?

Socket for GitHub automatically highlights issues in each pull request and monitors the health of all your open source dependencies. Discover the contents of your packages and block harmful activity before you install or update your dependencies.

Product
Socket’s new Tier 1 Reachability filters out up to 80% of irrelevant CVEs, so security teams can focus on the vulnerabilities that matter.

Research
/Security News
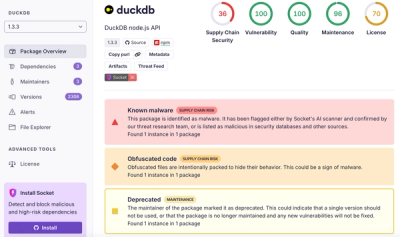
Ongoing npm supply chain attack spreads to DuckDB: multiple packages compromised with the same wallet-drainer malware.

Security News
The MCP Steering Committee has launched the official MCP Registry in preview, a central hub for discovering and publishing MCP servers.