
Security News
Deno 2.6 + Socket: Supply Chain Defense In Your CLI
Deno 2.6 introduces deno audit with a new --socket flag that plugs directly into Socket to bring supply chain security checks into the Deno CLI.
By Sarah Gooding - Dec 12, 2025
cypress-duration-metrics
Advanced tools
Measure duration of commands and different stages of cypress lifecycle.
Plugin for measuring total duration of the different commands and some stages of the
cypress run lifecycle. Helps to identify where tests spend a lot of time
and potentially come up with performance improvements.
NOTE: Some stage totals and their labels are based on certain assumptions that might not be correct. These should improve over time as more insight is gained.
NOTE: Metrics are displayed properly only on
cypress run. This plugin is meant for measuring performance on pipelines.
>=10.0.0npm i --save-dev cypress-duration-metrics
esModuleInterop is enabled.cypress.config.{js|ts}
import registerDurationMetricsPlugin from 'cypress-duration-metrics/plugin';

export default defineConfig({
  e2e: {
    setupNodeEvents(on, config) {
      registerDurationMetricsPlugin(on);
    }
  }
});
cypress/support/e2e.{js|ts}
import registerDurationMetricsSupport from 'cypress-duration-metrics/support';
registerDurationMetricsSupport();
Tracking preprocessor time is currently only supported if you are using custom preprocessor. If you are using the builtin default one of cypress it won't work. To enable the measurement you need to warp your preprocessor callback.
The tracking should work with any kind of preprocessor, but the example below uses webpack. Your plugin file should look something like this:
import {registerDurationMetricsPlugin} from 'cypress-duration-metrics/plugin';

export default defineConfig({
   e2e: {
      setupNodeEvents(on, config) {
         const {measurePreprocessorDuration} = registerDurationMetricsPlugin(on);
         // .. webpackProcessor initiated here
         on('file:preprocessor', measurePreprocessorDuration(webpackProcessor));
      }
   }
});
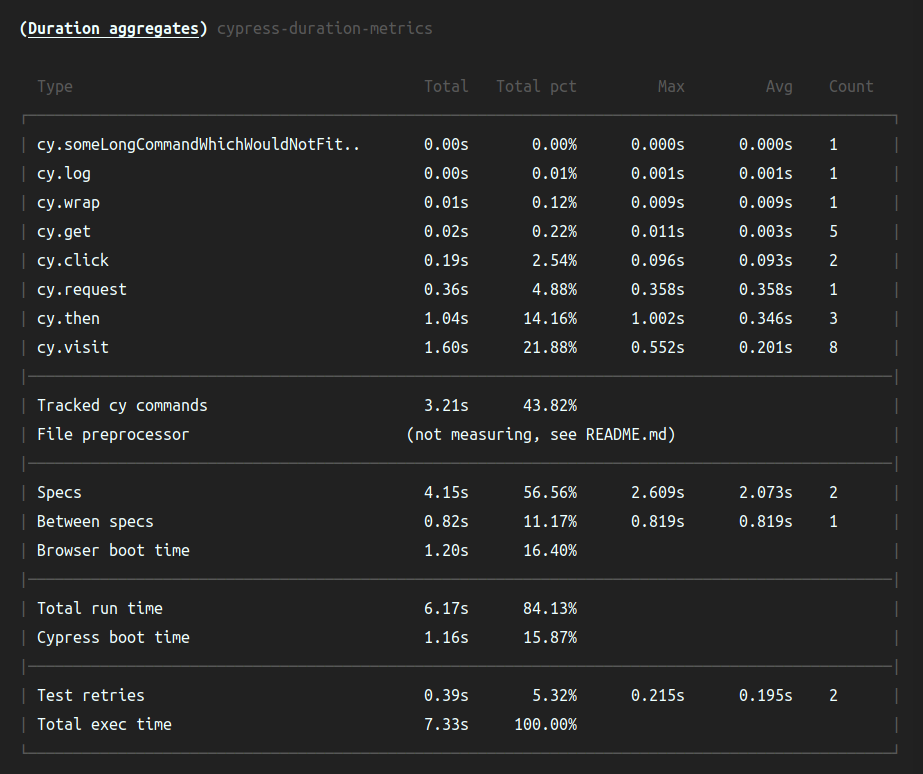
Total exec timeTime spent between the plugins require time and after:run dispatch.
This is the current best approximation of the absolute total duration of the cypress run command.
But it is not entirely correct, as there is still time that can be spent by cypress before loading
in the plugin and after after:run on shutdown.
Test retriesTime spent on tests from all specs that failed and retried. Time is measured only from the retries and not the first try, which is considered the main execution.
Total run timeTime spent between before:run and after:run dispatch.
Cypress boot timeThis is the difference between Total exec time and Total run time. Current assumption is that
this time is taken up by cypress to prepare everything to start the run, like plugins, events
and servers.
SpecsTotal time spent on each spec. A specs time is measured between before:spec and after:spec
dispatches.
Between specsTotal time spent in-between specs. This measurement is always 0 when there is only 1 spec in the
whole run. The time is measured between after:spec of previous and before:spec of current test.
Between testsSame as Between specs, but for individual tests isolated per spec.
Between commandsSame as Between specs, but for commands isolated per tests.
Browser boot timeThis is the equivalent of (Total run time - Between specs - Specs). The current assumption
is that this time is spent on actually opening the browser. But most likely there are other things
here.
File preprocessorThe total time spent on compiling your spec files and the support file. The count on this metric should be equal to the number of specs + 1 for the support file (e2e.js).
Tracked cy commandsThis is the total time spent on executing cypress commands.
cy.*Total duration for a specific cypress command. All runs of the command are measured and added together. You can see also the average duration for the command, the max duration and also how many times it was run. Only commands that were used during the run will appear.
FAQs
Measure duration of commands and different stages of cypress lifecycle.
The npm package cypress-duration-metrics receives a total of 525 weekly downloads. As such, cypress-duration-metrics popularity was classified as not popular.
We found that cypress-duration-metrics demonstrated a not healthy version release cadence and project activity because the last version was released a year ago. It has 1 open source maintainer collaborating on the project.
Did you know?

Socket for GitHub automatically highlights issues in each pull request and monitors the health of all your open source dependencies. Discover the contents of your packages and block harmful activity before you install or update your dependencies.
Security News
Deno 2.6 introduces deno audit with a new --socket flag that plugs directly into Socket to bring supply chain security checks into the Deno CLI.

Security News
New DoS and source code exposure bugs in React Server Components and Next.js: what’s affected and how to update safely.

Security News
Socket CEO Feross Aboukhadijeh joins Software Engineering Daily to discuss modern software supply chain attacks and rising AI-driven security risks.