Cypress duration metrics 

Plugin for measuring total duration of the different commands and some stages of the
cypress run lifecycle. Helps to identify where tests spend a lot of time
and potentially come up with performance improvements.
NOTE: Some stage totals and their labels are based on certain assumptions that might not
be correct. These should improve over time as more insight is gained.
NOTE: Metrics are displayed properly only on cypress run. This plugin is meant for
measuring performance on pipelines.
Install
Requirements
- requires cypress
>=10.0.0
- Install npm package.
npm i --save-dev cypress-duration-metrics
- If using typescript and esm imports ensure
esModuleInterop is enabled.
- Register the output plugin in
cypress.config.{js|ts}
import registerDurationMetricsPlugin from 'cypress-duration-metrics/plugin';

export default defineConfig({
  e2e: {
    setupNodeEvents(on, config) {
      registerDurationMetricsPlugin(on);
    }
  }
});
- Register the collector support in
cypress/support/e2e.{js|ts}
import registerDurationMetricsSupport from 'cypress-duration-metrics/support';
registerDurationMetricsSupport();
Preprocessor duration
Tracking preprocessor time is currently only supported if you are using custom preprocessor.
If you are using the builtin default one of cypress it won't work. To enable the measurement
you need to warp your preprocessor callback.
The tracking should work with any kind of preprocessor,
but the example below uses webpack. Your plugin file should look something like this:
import {registerDurationMetricsPlugin} from 'cypress-duration-metrics/plugin';
export default defineConfig({
e2e: {
setupNodeEvents(on, config) {
const {measurePreprocessorDuration} = registerDurationMetricsPlugin(on);
on('file:preprocessor', measurePreprocessorDuration(webpackProcessor));
}
}
});
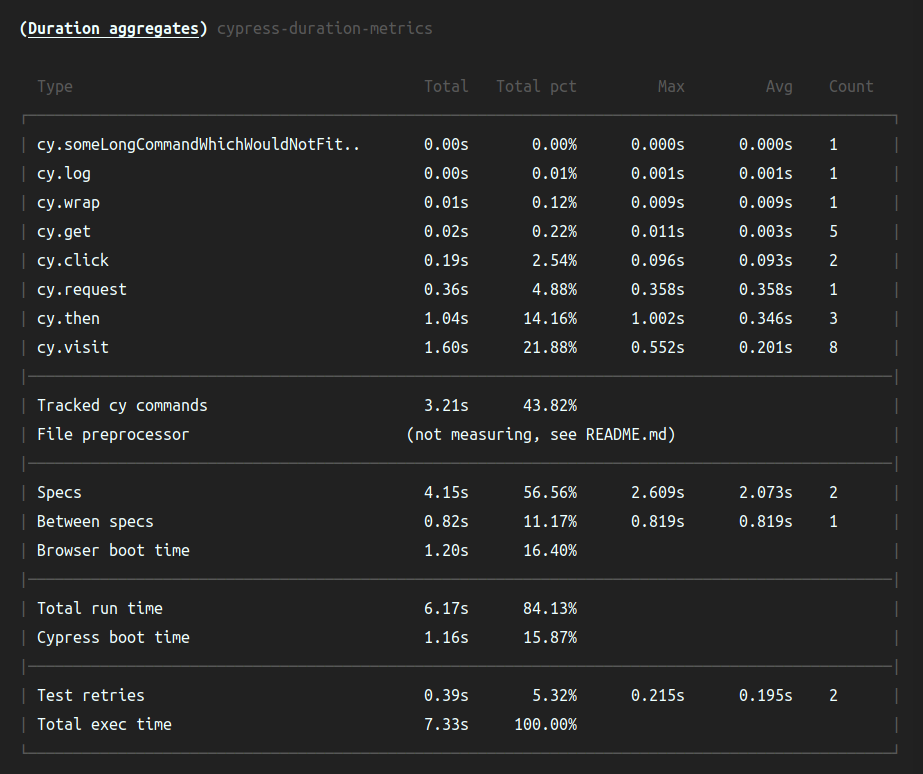
Metrics explained
Total exec time
Time spent between the plugins require time and after:run dispatch.
This is the current best approximation of the absolute total duration of the command.
But it is not entirely correct, as there is still time that can be spent by cypress before loading
in the plugin and after after:run on shutdown.
Test retries
Time spent on tests from all specs that failed and retried. Time is measured only from the retries
and not the last try, which is considered the main execution.
Total run time
Time spent between before:run and after:run dispatch.
Cypress boot time
This is the difference between Total exec time and Total run time. Current assumption is that
this time is taken up by cypress to prepare everything to start the run, like plugins, events
and servers.
Specs
Total time spent on each spec. A specs time is measured between before:spec and after:spec
dispatches.
Between specs
Total time spent in-between specs. This measurement is always 0 when there is only 1 spec in the
whole run. The time is measure between after:spec of previous and before:spec of current test.
Browser boot time
This is the equivalent of (Total run time - Between specs - Specs). The current assumption
is that this time is spent on actually opening the browser. But most likely there are other things
here.
File preprocessor
The total time spent on compiling your spec files and the support file. The count on this metric
should be equal to the number of specs + 1 for the support file (e2e.js).
Tracked cy commands
This is the total time spent on executing cypress commands.
cy.*
Total duration for a specific command. All runs of the command are measured and added together.
You can see also the average duration for the command, the max duration and also how many times
it was run. Only commands that were used during the run will appear.