d3-gtimeline
Google-like timeline chart. Demo.
Installing
If you use NPM, npm install d3-gtimeline. Otherwise, download the latest release.
API Reference
# d3.timeline() <>
Creates a function to generate charts on the selection. Use the standard D3 selection.call with datum.
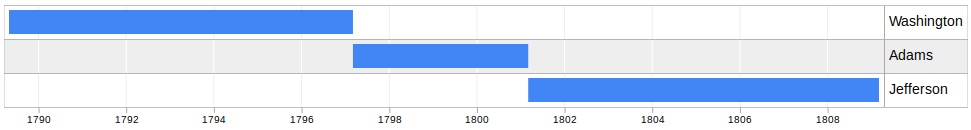
Example below shows how to create the simple chart similar to the one from Google timeline chart manual:
const chart = d3.timeline(),
  data = [
    ["Washington", "", new Date(1789, 3, 30), new Date(1797, 2, 4)],
    ["Adams", "", new Date(1797, 2, 4), new Date(1801, 2, 4)],
    ["Jefferson", "", new Date(1801, 2, 4), new Date(1809, 2, 4)],
  ];

d3.select("div").datum(data).call(chart);
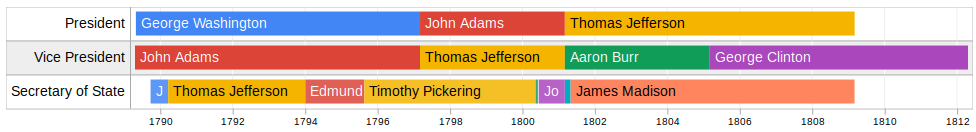
More advanced example (as well based on the data from Google timeline chart manual)
const chart = d3.timeline(),
  data = [
    ["President", "George Washington", new Date(1789, 3, 30), new Date(1797, 2, 4)],
    ["President", "John Adams", new Date(1797, 2, 4), new Date(1801, 2, 4)],
    ["President", "Thomas Jefferson", new Date(1801, 2, 4), new Date(1809, 2, 4)],
    ["Vice President", "John Adams", new Date(1789, 3, 21), new Date(1797, 2, 4)],
    ["Vice President", "Thomas Jefferson", new Date(1797, 2, 4), new Date(1801, 2, 4)],
    ["Vice President", "Aaron Burr", new Date(1801, 2, 4), new Date(1805, 2, 4)],
    ["Vice President", "George Clinton", new Date(1805, 2, 4), new Date(1812, 3, 20)],
    ["Secretary of State", "John Jay", new Date(1789, 8, 25), new Date(1790, 2, 22)],
    ["Secretary of State", "Thomas Jefferson", new Date(1790, 2, 22), new Date(1793, 11, 31)],
    ["Secretary of State", "Edmund Randolph", new Date(1794, 0, 2), new Date(1795, 7, 20)],
    ["Secretary of State", "Timothy Pickering", new Date(1795, 7, 20), new Date(1800, 4, 12)],
    ["Secretary of State", "Charles Lee", new Date(1800, 4, 13), new Date(1800, 5, 5)],
    ["Secretary of State", "John Marshall", new Date(1800, 5, 13), new Date(1801, 2, 4)],
    ["Secretary of State", "Levi Lincoln", new Date(1801, 2, 5), new Date(1801, 4, 1)],
    ["Secretary of State", "James Madison", new Date(1801, 4, 2), new Date(1809, 2, 3)],
  ];

d3.select("div").datum(data).call(chart);
# timeline.width([value]) <>
Returns or sets explicit width of the chart. If this value is null, width of the chart is adapted to the width of the parent node.
# timeline.padding([value]) <>
Returns or sets padding value for elements in the timeline.
# timeline.today([value]) <>
Returns or sets a boolean value to show/hide the today line on the timescale. Default: false.
# timeline.duration([value]) <>
Returns or sets the duration of the horizontal animation. Default: 0.
# timeline.colors([array]) <>
Returns or sets array containing colors to be used. Default colorset contains Google colors.
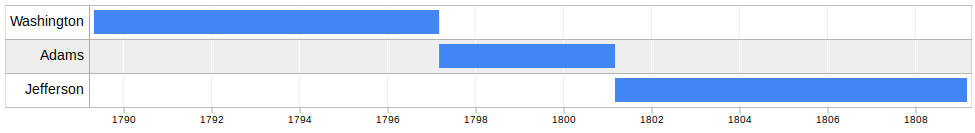
# timeline.reversed([boolean]) <>
If true flips the chart and shows the labels on the right side. Default value is false i.e. left side labels.