Product
Socket for Jira Is Now Available
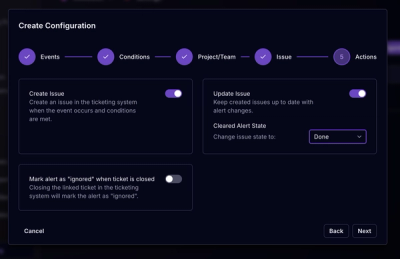
Socket for Jira lets teams turn alerts into Jira tickets with manual creation, automated ticketing rules, and two-way sync.
By Jeppe Hasseriis - Apr 20, 2026
echarts-for-react
Advanced tools
The simplest, and the best React wrapper for Apache ECharts. Using visualization with MCP Server mcp-server-chart.

![]()


![]()
![]()
$ npm install --save echarts-for-react
# `echarts` is the peerDependence of `echarts-for-react`, you can install echarts with your own version.
$ npm install --save echarts
Then use it.
import ReactECharts from 'echarts-for-react';

// render echarts option.
<ReactECharts option={this.getOption()} />
You can run website.
$ git clone git@github.com:hustcc/echarts-for-react.git

$ npm install

$ npm start
Then open http://127.0.0.1:8081/ in your browser. or see https://git.hust.cc/echarts-for-react/ which is deploy on gh-pages.
Code of a simple demo code showed below. For more example can see: https://git.hust.cc/echarts-for-react/
import React from 'react';
import ReactECharts from 'echarts-for-react';  // or var ReactECharts = require('echarts-for-react');

<ReactECharts
  option={this.getOption()}
  notMerge={true}
  lazyUpdate={true}
  theme={"theme_name"}
  onChartReady={this.onChartReadyCallback}
  onEvents={EventsDict}
  opts={}
/>
Import ECharts.js modules manually to reduce bundle size
With Echarts.js v5 or v6:
import React from 'react';
// import the core library.
import ReactEChartsCore from 'echarts-for-react/lib/core';
// Import the echarts core module, which provides the necessary interfaces for using echarts.
import * as echarts from 'echarts/core';
// Import charts, all with Chart suffix
import {
  // LineChart,
  BarChart,
  // PieChart,
  // ScatterChart,
  // RadarChart,
  // MapChart,
  // TreeChart,
  // TreemapChart,
  // GraphChart,
  // GaugeChart,
  // FunnelChart,
  // ParallelChart,
  // SankeyChart,
  // BoxplotChart,
  // CandlestickChart,
  // EffectScatterChart,
  // LinesChart,
  // HeatmapChart,
  // PictorialBarChart,
  // ThemeRiverChart,
  // SunburstChart,
  // CustomChart,
} from 'echarts/charts';
// import components, all suffixed with Component
import {
  // GridSimpleComponent,
  GridComponent,
  // PolarComponent,
  // RadarComponent,
  // GeoComponent,
  // SingleAxisComponent,
  // ParallelComponent,
  // CalendarComponent,
  // GraphicComponent,
  // ToolboxComponent,
  TooltipComponent,
  // AxisPointerComponent,
  // BrushComponent,
  TitleComponent,
  // TimelineComponent,
  // MarkPointComponent,
  // MarkLineComponent,
  // MarkAreaComponent,
  // LegendComponent,
  // LegendScrollComponent,
  // LegendPlainComponent,
  // DataZoomComponent,
  // DataZoomInsideComponent,
  // DataZoomSliderComponent,
  // VisualMapComponent,
  // VisualMapContinuousComponent,
  // VisualMapPiecewiseComponent,
  // AriaComponent,
  // TransformComponent,
  DatasetComponent,
} from 'echarts/components';
// Import renderer, note that introducing the CanvasRenderer or SVGRenderer is a required step
import {
  CanvasRenderer,
  // SVGRenderer,
} from 'echarts/renderers';

// Register the required components
echarts.use(
  [TitleComponent, TooltipComponent, GridComponent, BarChart, CanvasRenderer]
);

// The usage of ReactEChartsCore are same with above.
<ReactEChartsCore
  echarts={echarts}
  option={this.getOption()}
  notMerge={true}
  lazyUpdate={true}
  theme={"theme_name"}
  onChartReady={this.onChartReadyCallback}
  onEvents={EventsDict}
  opts={}
/>
With Echarts.js v3 or v4:
import React from 'react';
// import the core library.
import ReactEChartsCore from 'echarts-for-react/lib/core';

// then import echarts modules those you have used manually.
import echarts from 'echarts/lib/echarts';
// import 'echarts/lib/chart/line';
import 'echarts/lib/chart/bar';
// import 'echarts/lib/chart/pie';
// import 'echarts/lib/chart/scatter';
// import 'echarts/lib/chart/radar';

// import 'echarts/lib/chart/map';
// import 'echarts/lib/chart/treemap';
// import 'echarts/lib/chart/graph';
// import 'echarts/lib/chart/gauge';
// import 'echarts/lib/chart/funnel';
// import 'echarts/lib/chart/parallel';
// import 'echarts/lib/chart/sankey';
// import 'echarts/lib/chart/boxplot';
// import 'echarts/lib/chart/candlestick';
// import 'echarts/lib/chart/effectScatter';
// import 'echarts/lib/chart/lines';
// import 'echarts/lib/chart/heatmap';

// import 'echarts/lib/component/graphic';
// import 'echarts/lib/component/grid';
// import 'echarts/lib/component/legend';
import 'echarts/lib/component/tooltip';
// import 'echarts/lib/component/polar';
// import 'echarts/lib/component/geo';
// import 'echarts/lib/component/parallel';
// import 'echarts/lib/component/singleAxis';
// import 'echarts/lib/component/brush';

import 'echarts/lib/component/title';

// import 'echarts/lib/component/dataZoom';
// import 'echarts/lib/component/visualMap';

// import 'echarts/lib/component/markPoint';
// import 'echarts/lib/component/markLine';
// import 'echarts/lib/component/markArea';

// import 'echarts/lib/component/timeline';
// import 'echarts/lib/component/toolbox';

// import 'zrender/lib/vml/vml';

// The usage of ReactEChartsCore are same with above.
<ReactEChartsCore
  echarts={echarts}
  option={this.getOption()}
  notMerge={true}
  lazyUpdate={true}
  theme={"theme_name"}
  onChartReady={this.onChartReadyCallback}
  onEvents={EventsDict}
  opts={}
/>
For Next.js user, code transpilation is needed. For Next.js 13.1 or higher, as all next-transpile-modules features are natively built-in and the package has been deprecated, so please add transpilePackages: ['echarts', 'zrender'] into nextConfig object:
// next.config.js
/** @type {import('next').NextConfig} */

const nextConfig = {
  // ...existing properties,
  transpilePackages: ['echarts', 'zrender'],
}

module.exports = nextConfig
For Next.js with version < 13.1:
// next.config.js
const withTM = require("next-transpile-modules")(["echarts", "zrender"]);

module.exports = withTM({})
option (required, object)the echarts option config, can see https://echarts.apache.org/option.html#title.
notMerge (optional, object)when setOption, not merge the data, default is false. See https://echarts.apache.org/api.html#echartsInstance.setOption.
replaceMerge (optional, string | string[])when setOption, default is null. See https://echarts.apache.org/api.html#echartsInstance.setOption.
lazyUpdate (optional, object)when setOption, lazy update the data, default is false. See https://echarts.apache.org/api.html#echartsInstance.setOption.
style (optional, object)the style of echarts div. object, default is {height: '300px'}.
className (optional, string)the class of echarts div. you can setting the css style of charts by class name.
theme (optional, string)the theme of echarts. string, should registerTheme before use it (theme object format: https://github.com/ecomfe/echarts/blob/master/theme/dark.js). e.g.
// import echarts
import echarts from 'echarts';
...
// register theme object
echarts.registerTheme('my_theme', {
  backgroundColor: '#f4cccc'
});
...
// render the echarts use option `theme`
<ReactECharts
  option={this.getOption()}
  style={{height: '300px', width: '100%'}}
  className='echarts-for-echarts'
  theme='my_theme' />
onChartReady (optional, function)when the chart is ready, will callback the function with the echarts object as it's paramter.
loadingOption (optional, object)the echarts loading option config, can see https://echarts.apache.org/api.html#echartsInstance.showLoading.
showLoading (optional, bool, default: false)bool, when the chart is rendering, show the loading mask.
onEvents (optional, array(string=>function) )binding the echarts event, will callback with the echarts event object, and the echart object as it's paramters. e.g:
const onEvents = {
  'click': this.onChartClick,
  'legendselectchanged': this.onChartLegendselectchanged
}
...
<ReactECharts
  option={this.getOption()}
  style={{ height: '300px', width: '100%' }}
  onEvents={onEvents}
/>
for more event key name, see: https://echarts.apache.org/api.html#events
opts (optional, object)the opts of echarts. object, will be used when initial echarts instance by echarts.init. Document here.
<ReactECharts
  option={this.getOption()}
  style={{ height: '300px' }}
  opts={{renderer: 'svg'}} // use svg to render the chart.
/>
autoResize (optional, boolean)decide whether to trigger this.resize when window resize. default is true.
the Component only has one API named getEchartsInstance.
getEchartsInstance() : get the echarts instance object, then you can use any API of echarts.for example:
// render the echarts component below with rel
<ReactECharts
  ref={(e) => { this.echartRef = e; }}
  option={this.getOption()}
/>

// then get the `ReactECharts` use this.echarts_react

const echartInstance = this.echartRef.getEchartsInstance();
// then you can use any API of echarts.
const base64 = echartInstance.getDataURL();
TypeScript and useRef() example:
const getOption = () => {/** */};

export default function App() {
	const echartsRef = useRef<InstanceType<typeof ReactEcharts>>(null);

	useEffect(() => {
		if (echartsRef.current) {
			const echartsInstance = echartsRef.current.getEchartsInstance();
			// do something
			echartsInstance.resize();
		}
	}, []);
	return <ReactEcharts ref={echartsRef} option={getOption()} />;
}
About API of echarts, can see https://echarts.apache.org/api.html#echartsInstance.
You can use the API to do:
binding / unbinding event.dynamic charts with dynamic data.release the charts.Use the props opts of component with renderer = 'svg'. For example:
<ReactECharts
  option={this.getOption()}
  style={{height: '300px'}}
  opts={{renderer: 'svg'}} // use svg to render the chart.
/>
Component series.scatter3D not exists. Load it first.Install and import echarts-gl module when you want to create a GL instance
npm install --save echarts-gl
import 'echarts-gl'
import ReactECharts from "echarts-for-react";

<ReactECharts
  option={GL_OPTION}
/>
MIT@hustcc.
react-chartjs-2 is a React wrapper for Chart.js, a popular charting library. It provides a variety of chart types and is known for its simplicity and ease of use. Compared to echarts-for-react, react-chartjs-2 may have fewer customization options but is often easier to set up and use for basic charts.
Recharts is a composable charting library built on React components. It is highly customizable and provides a wide range of chart types. Recharts is known for its declarative approach and ease of integration with React applications. Compared to echarts-for-react, Recharts offers a more React-centric API and may be more intuitive for React developers.
Victory is a modular charting library for React and React Native. It provides a wide range of chart types and is designed to be highly customizable and flexible. Victory is known for its robust documentation and active community. Compared to echarts-for-react, Victory offers a more component-based approach and may be more suitable for complex, custom visualizations.
FAQs
Apache Echarts components for React.
The npm package echarts-for-react receives a total of 715,186 weekly downloads. As such, echarts-for-react popularity was classified as popular.
We found that echarts-for-react demonstrated a healthy version release cadence and project activity because the last version was released less than a year ago. It has 1 open source maintainer collaborating on the project.
Did you know?

Socket for GitHub automatically highlights issues in each pull request and monitors the health of all your open source dependencies. Discover the contents of your packages and block harmful activity before you install or update your dependencies.
Product
Socket for Jira lets teams turn alerts into Jira tickets with manual creation, automated ticketing rules, and two-way sync.

Company News
Socket won two 2026 Reppy Awards from RepVue, ranking in the top 5% of all sales orgs. AE Alexandra Lister shares what it's like to grow a sales career here.

Security News
NIST will stop enriching most CVEs under a new risk-based model, narrowing the NVD's scope as vulnerability submissions continue to surge.