Product
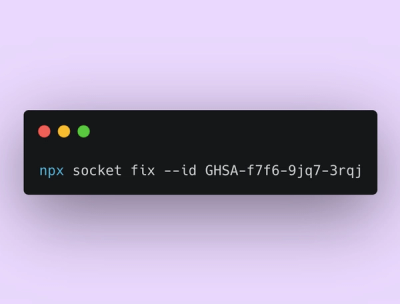
Announcing Socket Fix 2.0
Socket Fix 2.0 brings targeted CVE remediation, smarter upgrade planning, and broader ecosystem support to help developers get to zero alerts.
react-chartjs-2
Advanced tools
The react-chartjs-2 npm package is a React wrapper for Chart.js, a popular JavaScript library for creating simple yet flexible charts. It allows developers to create various types of charts such as line, bar, radar, doughnut, and pie charts, among others, with ease. The package provides React components that encapsulate Chart.js functionality, making it easy to integrate into React applications.
Line Chart
This code sample demonstrates how to create a simple line chart using react-chartjs-2. It includes a dataset for monthly sales and configures the chart to start the y-axis at zero.
{"import { Line } from 'react-chartjs-2';\n\nconst data = {\n labels: ['January', 'February', 'March', 'April', 'May', 'June'],\n datasets: [{\n label: 'Monthly Sales',\n data: [65, 59, 80, 81, 56, 55],\n fill: false,\n borderColor: 'rgb(75, 192, 192)',\n tension: 0.1\n }]\n};\n\nconst options = {\n scales: {\n y: {\n beginAtZero: true\n }\n }\n};\n\nfunction MyLineChart() {\n return <Line data={data} options={options} />;\n}"}Bar Chart
This code sample shows how to create a bar chart with react-chartjs-2. It sets up a dataset with different colors for each bar representing votes for different options.
{"import { Bar } from 'react-chartjs-2';\n\nconst data = {\n labels: ['Red', 'Blue', 'Yellow', 'Green', 'Purple', 'Orange'],\n datasets: [{\n label: 'Votes',\n data: [12, 19, 3, 5, 2, 3],\n backgroundColor: [\n 'rgba(255, 99, 132, 0.2)',\n 'rgba(54, 162, 235, 0.2)',\n 'rgba(255, 206, 86, 0.2)',\n 'rgba(75, 192, 192, 0.2)',\n 'rgba(153, 102, 255, 0.2)',\n 'rgba(255, 159, 64, 0.2)'\n ],\n borderColor: [\n 'rgba(255, 99, 132, 1)',\n 'rgba(54, 162, 235, 1)',\n 'rgba(255, 206, 86, 1)',\n 'rgba(75, 192, 192, 1)',\n 'rgba(153, 102, 255, 1)',\n 'rgba(255, 159, 64, 1)'\n ],\n borderWidth: 1\n }]\n};\n\nfunction MyBarChart() {\n return <Bar data={data} />;\n}"}Doughnut Chart
This code sample illustrates how to create a doughnut chart using react-chartjs-2. It includes a dataset with three segments, each with its own color.
{"import { Doughnut } from 'react-chartjs-2';\n\nconst data = {\n labels: ['Red', 'Blue', 'Yellow'],\n datasets: [{\n data: [300, 50, 100],\n backgroundColor: [\n '#FF6384',\n '#36A2EB',\n '#FFCE56'\n ],\n hoverBackgroundColor: [\n '#FF6384',\n '#36A2EB',\n '#FFCE56'\n ]\n }]\n};\n\nfunction MyDoughnutChart() {\n return <Doughnut data={data} />;\n}"}Recharts is a composable charting library built on React components. It uses D3.js under the hood for sophisticated charting capabilities. Compared to react-chartjs-2, Recharts offers a more React-friendly API with the ability to compose charts using declarative components.
Victory is another React chart library that provides an extensive collection of composable components for building interactive data visualizations. Victory charts are highly customizable and can be styled using standard inline styles, which might appeal to developers looking for a more integrated React experience compared to react-chartjs-2.
Nivo provides a rich set of dataviz components built on top of D3.js, with a strong emphasis on motion and interactivity. It offers a higher level of abstraction compared to react-chartjs-2 and includes a wide range of chart types with beautiful default styles and animations.

React components for Chart.js, the most popular charting library.
Supports Chart.js v4 and v3.
Install this library with peer dependencies:
pnpm add react-chartjs-2 chart.js
# or
yarn add react-chartjs-2 chart.js
# or
npm i react-chartjs-2 chart.js
We recommend using chart.js@^4.0.0.
Then, import and use individual components:
import { Doughnut } from 'react-chartjs-2';

<Doughnut data={...} />
MIT Licensed Copyright (c) 2020 Jeremy Ayerst
FAQs
React components for Chart.js
The npm package react-chartjs-2 receives a total of 1,776,168 weekly downloads. As such, react-chartjs-2 popularity was classified as popular.
We found that react-chartjs-2 demonstrated a healthy version release cadence and project activity because the last version was released less than a year ago. It has 4 open source maintainers collaborating on the project.
Did you know?

Socket for GitHub automatically highlights issues in each pull request and monitors the health of all your open source dependencies. Discover the contents of your packages and block harmful activity before you install or update your dependencies.

Product
Socket Fix 2.0 brings targeted CVE remediation, smarter upgrade planning, and broader ecosystem support to help developers get to zero alerts.

Security News
Socket CEO Feross Aboukhadijeh joins Risky Business Weekly to unpack recent npm phishing attacks, their limited impact, and the risks if attackers get smarter.

Product
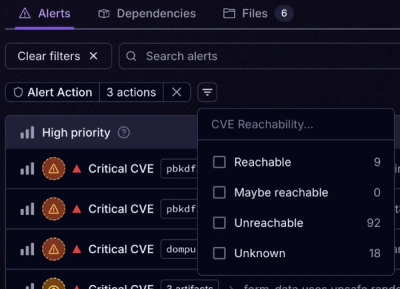
Socket’s new Tier 1 Reachability filters out up to 80% of irrelevant CVEs, so security teams can focus on the vulnerabilities that matter.