
Security News
CVE Volume Surges Past 48,000 in 2025 as WordPress Plugin Ecosystem Drives Growth
CVE disclosures hit a record 48,185 in 2025, driven largely by vulnerabilities in third-party WordPress plugins.
By Sarah Gooding - Jan 09, 2026
Interactive diagrams, charts, and graphs, such as trees, flowcharts, orgcharts, UML, BPMN, or business diagrams

GoJS is a JavaScript and TypeScript library for creating and manipulating diagrams, charts, and graphs.


GoJS is a flexible library that can be used to create a number of different kinds of interactive diagrams, including data visualizations, drawing tools, and graph editors. There are samples for flowchart, org chart, business process BPMN, swimlanes, timelines, state charts, kanban, network, mindmap, sankey, family trees and genogram charts, fishbone diagrams, floor plans, UML, decision trees, PERT charts, Gantt, and hundreds more. GoJS includes a number of built in layouts including tree layout, force directed, circular, and layered digraph layout, and many custom layout extensions and examples.
GoJS is renders either to an HTML Canvas element (with export to SVG or image formats) or directly as SVG DOM. GoJS can run in a web browser, or server side in Node or Puppeteer. GoJS Diagrams are backed by Models, with saving and loading typically via JSON-formatted text.
Read more about GoJS at gojs.net
The GitHub repository and the GoJS website contain not only the library, but also the sources for all samples, extensions, and documentation.
However the npm package contains only the library. You can install the GoJS library using npm:
$ npm install gojs
The samples, extensions, and documentation can be installed by running:
$ npm create gojs-kit
You can use the GitHub repository to quickly search through all of the sources.
Diagrams are built by creating one or more templates, with desired properties data-bound, and adding model data.
<div id="myDiagramDiv" style="width:400px; height:200px;"></div>

<script src="https://cdn.jsdelivr.net/npm/gojs"></script>

<script>
  const myDiagram = new go.Diagram('myDiagramDiv', {
    // create a Diagram for the HTML Div element
    'undoManager.isEnabled': true // enable undo & redo
  });

  // define a simple Node template
  // the Shape will automatically surround the TextBlock
  myDiagram.nodeTemplate = new go.Node('Auto').add(
    // add a Shape and a TextBlock to this "Auto" Panel
    new go.Shape('RoundedRectangle', { strokeWidth: 0, fill: 'white' }) // no border; default fill is white
      .bind('fill', 'color'), // Shape.fill is bound to Node.data.color
    new go.TextBlock({ margin: 8, font: 'bold 14px sans-serif', stroke: '#333' }) // some room around the text
      .bind('text', 'key') // TextBlock.text is bound to Node.data.key
  );

  // but use the default Link template, by not setting Diagram.linkTemplate

  // create the model data that will be represented by Nodes and Links
  myDiagram.model = new go.GraphLinksModel(
    [
      { key: 'Alpha', color: 'lightblue' },
      { key: 'Beta', color: 'orange' },
      { key: 'Gamma', color: 'lightgreen' },
      { key: 'Delta', color: 'pink' }
    ],
    [
      { from: 'Alpha', to: 'Beta' },
      { from: 'Alpha', to: 'Gamma' },
      { from: 'Beta', to: 'Beta' },
      { from: 'Gamma', to: 'Delta' },
      { from: 'Delta', to: 'Alpha' }
    ]
  );
</script>
The above diagram and model code creates the following graph. The user can now click on nodes or links to select them, copy-and-paste them, drag them, delete them, scroll, pan, and zoom, with a mouse or with fingers.
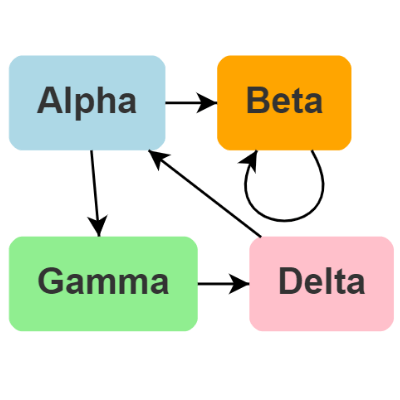
Click the above image to see the interactive GoJS Diagram
Northwoods Software offers a month of free developer-to-developer support for GoJS to prospective customers so you can finish your project faster.
Read and search the official GoJS forum for any topics related to your questions.
Posting in the forum is the fastest and most effective way of obtaining support for any GoJS related inquiries. Please register for support at Northwoods Software's registration form before posting in the forum.
For any nontechnical questions about GoJS, such as about sales or licensing, please visit Northwoods Software's contact form.
The GoJS software license.
The GoJS evaluation license.
Copyright Northwoods Software Corporation
FAQs
Interactive diagrams, charts, and graphs, such as trees, flowcharts, orgcharts, UML, BPMN, or business diagrams
The npm package gojs receives a total of 42,818 weekly downloads. As such, gojs popularity was classified as popular.
We found that gojs demonstrated a healthy version release cadence and project activity because the last version was released less than a year ago. It has 2 open source maintainers collaborating on the project.
Did you know?

Socket for GitHub automatically highlights issues in each pull request and monitors the health of all your open source dependencies. Discover the contents of your packages and block harmful activity before you install or update your dependencies.
Security News
CVE disclosures hit a record 48,185 in 2025, driven largely by vulnerabilities in third-party WordPress plugins.

Security News
Socket CEO Feross Aboukhadijeh joins Insecure Agents to discuss CVE remediation and why supply chain attacks require a different security approach.

Security News
Tailwind Labs laid off 75% of its engineering team after revenue dropped 80%, as LLMs redirect traffic away from documentation where developers discover paid products.