Product
Introducing the Alert Details Page: A Better Way to Explore Alerts
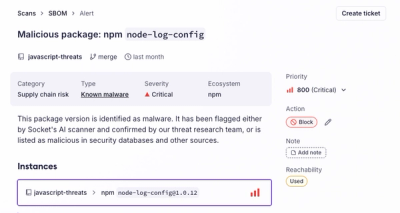
Socket's new Alert Details page is designed to surface more context, with a clearer layout, reachability dependency chains, and structured review.
graphics-debug
Advanced tools
Module for debugging graphics, turn log output into meaningful markdown and SVG diagrams.
Module for debugging graphics, turn log output into meaningful markdown and SVG diagrams.
Just pipe in output with graphics JSON objects into graphics-debug (or gd) to get an html file
with all your graphics drawn-in.
echo ':graphics { points: [{x: 0, y: 0, label: "hello world" }], title: "test graphic" } }' | graphics-debug
# wrote to "test-graphic-1.debug.svg"
# Run a program that has debug logs and pipe the output to graphics-debug
bun test path/to/test.ts |& graphics-debug --html
# wrote to "graphics.debug.html"

# another syntax for the same thing
bun test path/to/test.ts 2>&1 | graphics-debug --html
Don't want to write files everywhere? Use the --url flag to get a url to view
the graphics in a browser.
node myscript.js |& graphics-debug --url
Don't have access to the cli? Paste into the online version: https://graphicsdebug.com
https://github.com/user-attachments/assets/9f3f41e6-b0fe-416a-a551-ba5c5b920cad
The graphics json object is very simple, here's the basic schema:
interface Point {
  x: number
  y: number
  color?: string
  label?: string
  layer?: string
  step?: number
}

interface Line {
  points: { x: number; y: number }[]
  strokeWidth?: number
  strokeColor?: string
  strokeDash?: string
  layer?: string
  step?: number
  label?: string
}

interface Rect {
  center: { x: number; y: number }
  width: number
  height: number
  fill?: string
  stroke?: string
  color?: string
  layer?: string
  step?: number
  label?: string
}

interface Circle {
  center: { x: number; y: number }
  radius: number
  fill?: string
  stroke?: string
  layer?: string
  step?: number
  label?: string
}

interface Arrow {
  start: { x: number; y: number }
  end: { x: number; y: number }
  doubleSided?: boolean
  color?: string
}

interface GraphicsObject {
  points?: Point[]
  lines?: Line[]
  rects?: Rect[]
  circles?: Circle[]
  arrows?: Arrow[]
  coordinateSystem?: "cartesian" | "screen"
  title?: string
}
Note The
coordinateSystemfield is optional. If you omit it (as in the simple arrow examples below), the renderer uses a standard Cartesian orientation, so you only need to providexandycoordinates for your start and end points.
graphics-debug compatible logsThe best way to write graphics-debug compatible logs is to use the debug library.
You should always JSON.stringify graphics objects, otherwise the graphics will take up more lines and will not have the correct depth (there will be missing information)
import Debug from "debug"

const debugGraphics = Debug("mypackage:graphics")

const A = { x: 0, y: 0, label: "A" }
const B = { x: 1, y: 1, label: "B" }

debugGraphics(
  JSON.stringify({
    points: [A, B],
    title: "initial points for my algorithm",
  })
)

// ... do some algorithm stuff e.g....
const C = { x: (A.x + B.x) / 2, y: (A.y + B.y) / 2, label: "C" }

debugGraphics(
  JSON.stringify({
    points: [A, B, C],
    title: "final points for my algorithm",
  })
)
To see the output, you'll need to run DEBUG=mypackage:graphics in your terminal
before running the program. This makes it easy to turn on/off the graphics output
You can also use debugGraphics.enabled to conditionally emit graphics based,
this is useful if it's expensive to compute the graphics object.
import {
  getSvgFromLogString,
  getHtmlFromLogString,
  getSvgsFromLogString,
} from "graphics-debug"

const logString = `
hello world! This is some other content that will be ignored
here's some :graphics { points: [{x: 0, y: 0, label: "hello world" }], title: "test graphic" }
`

const svg = getSvgFromLogString(logString)
const html = getHtmlFromLogString(logString)

// If you want to parse for multiple SVGs
const svgs = getSvgsFromLogString(logString)
// Array<{ title: string; svg: string }>
graphics objects from a Debug Logimport { getGraphicsObjectsFromLogString } from "graphics-debug"
const graphicsObjects = getGraphicsObjectsFromLogString(logString)
// Array<GraphicsObject>
import { getSvgFromGraphicsObject } from "graphics-debug"

// Create your graphics object
const graphicsObject = {
  points: [
    { x: 0, y: 0, label: "Origin" },
    { x: 100, y: 100, color: "red" },
  ],
  lines: [
    {
      points: [
        { x: 0, y: 0 },
        { x: 100, y: 100 },
      ],
      strokeColor: "blue",
    },
  ],
  title: "My Graph",
}

// Generate SVG string directly from the object
const svg = getSvgFromGraphicsObject(graphicsObject)
// Returns a formatted SVG string ready to be written to a file or embedded in HTML
You can shift every element in a GraphicsObject by a fixed amount using translateGraphics.
import { translateGraphics } from "graphics-debug"

const moved = translateGraphics(graphicsObject, 10, 5)
Combine the contents of two graphics objects into one using mergeGraphics.
import { mergeGraphics } from "graphics-debug"

const combined = mergeGraphics(graphicsObjectA, graphicsObjectB)
Use stackGraphicsHorizontally or stackGraphicsVertically to place graphics next to or above each other.
import { stackGraphicsHorizontally, stackGraphicsVertically } from "graphics-debug"

const sideBySide = stackGraphicsHorizontally([
  graphicsObjectA,
  graphicsObjectB,
], { titles: ["A", "B"] })
const stacked = stackGraphicsVertically([
  graphicsObjectA,
  graphicsObjectB,
], { titles: ["A", "B"] })
If you're using Bun for testing, you can use the toMatchGraphicsSvg matcher to compare graphics objects against saved snapshots.
First, install the required peer dependencies:
bun add -d bun-match-svg looksSame
Then use the matcher in your tests:
import { expect, test } from "bun:test"
import "graphics-debug/matcher"
import type { GraphicsObject } from "graphics-debug"

// Your test graphics object
const graphicsObject: GraphicsObject = {
  points: [
    { x: 0, y: 0, label: "Origin" },
    { x: 100, y: 100, color: "red" },
  ],
  lines: [
    {
      points: [
        { x: 0, y: 0 },
        { x: 100, y: 100 },
      ],
      strokeColor: "blue",
    },
  ],
  title: "My Test Graphics",
}

test("should match the expected visualization", async () => {
  // First run creates the snapshot
  // Subsequent runs will compare against saved snapshot
  await expect(graphicsObject).toMatchGraphicsSvg(import.meta.path)

  // You can also provide a custom name for the snapshot:
  await expect(graphicsObject).toMatchGraphicsSvg(import.meta.path, {
    svgName: "custom-name",
  })
})
Snapshots are stored as SVG files in an __snapshots__ directory next to your test file. To update snapshots, run your tests with the -u or --update-snapshots flag:
bun test -u
This is powered by the same technology as bun-match-svg but integrated specifically for GraphicsObject testing.
An example graphics JSON file is provided in the repository to help you get started quickly.
You can find the example file at site/examples/exampleGraphics.json. This file contains a sample graphics object that you can use to test the functionality of the graphics-debug module.
Here is the content of the exampleGraphics.json file:
{
  "title": "Example Usage",
  "rects": [
    {
      "center": { "x": 0, "y": 0 },
      "width": 100,
      "height": 100,
      "fill": "green"
    }
  ],
  "points": [
    {
      "x": 50,
      "y": 50,
      "color": "red",
      "label": "Test Output!"
    }
  ]
}
You can load this example into the application to visualize the graphics objects and understand how the graphics-debug module works.
The package also includes React helpers under graphics-debug/react.
The <InteractiveGraphics> component renders an interactive viewer with
zoom, pan and layer/step filtering built in.
import { InteractiveGraphics } from "graphics-debug/react"
import exampleGraphics from "./exampleGraphics.json"

export default function Demo() {
  return <InteractiveGraphics graphics={exampleGraphics} />
}
InteractiveGraphics accepts a GraphicsObject via the graphics prop.
You can optionally handle clicks on objects with onObjectClicked, set the
viewer height with height, or limit how many objects are drawn with
objectLimit.
FAQs
Module for debugging graphics, turn log output into meaningful markdown and SVG diagrams.
The npm package graphics-debug receives a total of 8,150 weekly downloads. As such, graphics-debug popularity was classified as popular.
We found that graphics-debug demonstrated a healthy version release cadence and project activity because the last version was released less than a year ago. It has 1 open source maintainer collaborating on the project.
Did you know?

Socket for GitHub automatically highlights issues in each pull request and monitors the health of all your open source dependencies. Discover the contents of your packages and block harmful activity before you install or update your dependencies.

Product
Socket's new Alert Details page is designed to surface more context, with a clearer layout, reachability dependency chains, and structured review.

Product
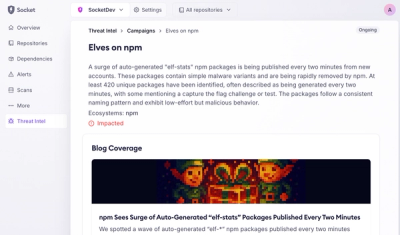
Campaign-level threat intelligence in Socket now shows when active supply chain attacks affect your repositories and packages.

Research
Malicious PyPI package sympy-dev targets SymPy users, a Python symbolic math library with 85 million monthly downloads.