HdrHistogram Widget
The purpose of this JavaScript widget is to easily visualize latencies recorded with HdrHistogram. The widget does not depend on any dependencies except HdrHistogramJS and hence may be used on any website.
This widget allows to plot histograms encoded to base64, whatever the HdrHistogram language/platform used (Java, JS, C#, Rust, Go...)
Usage
Passing data in a URL
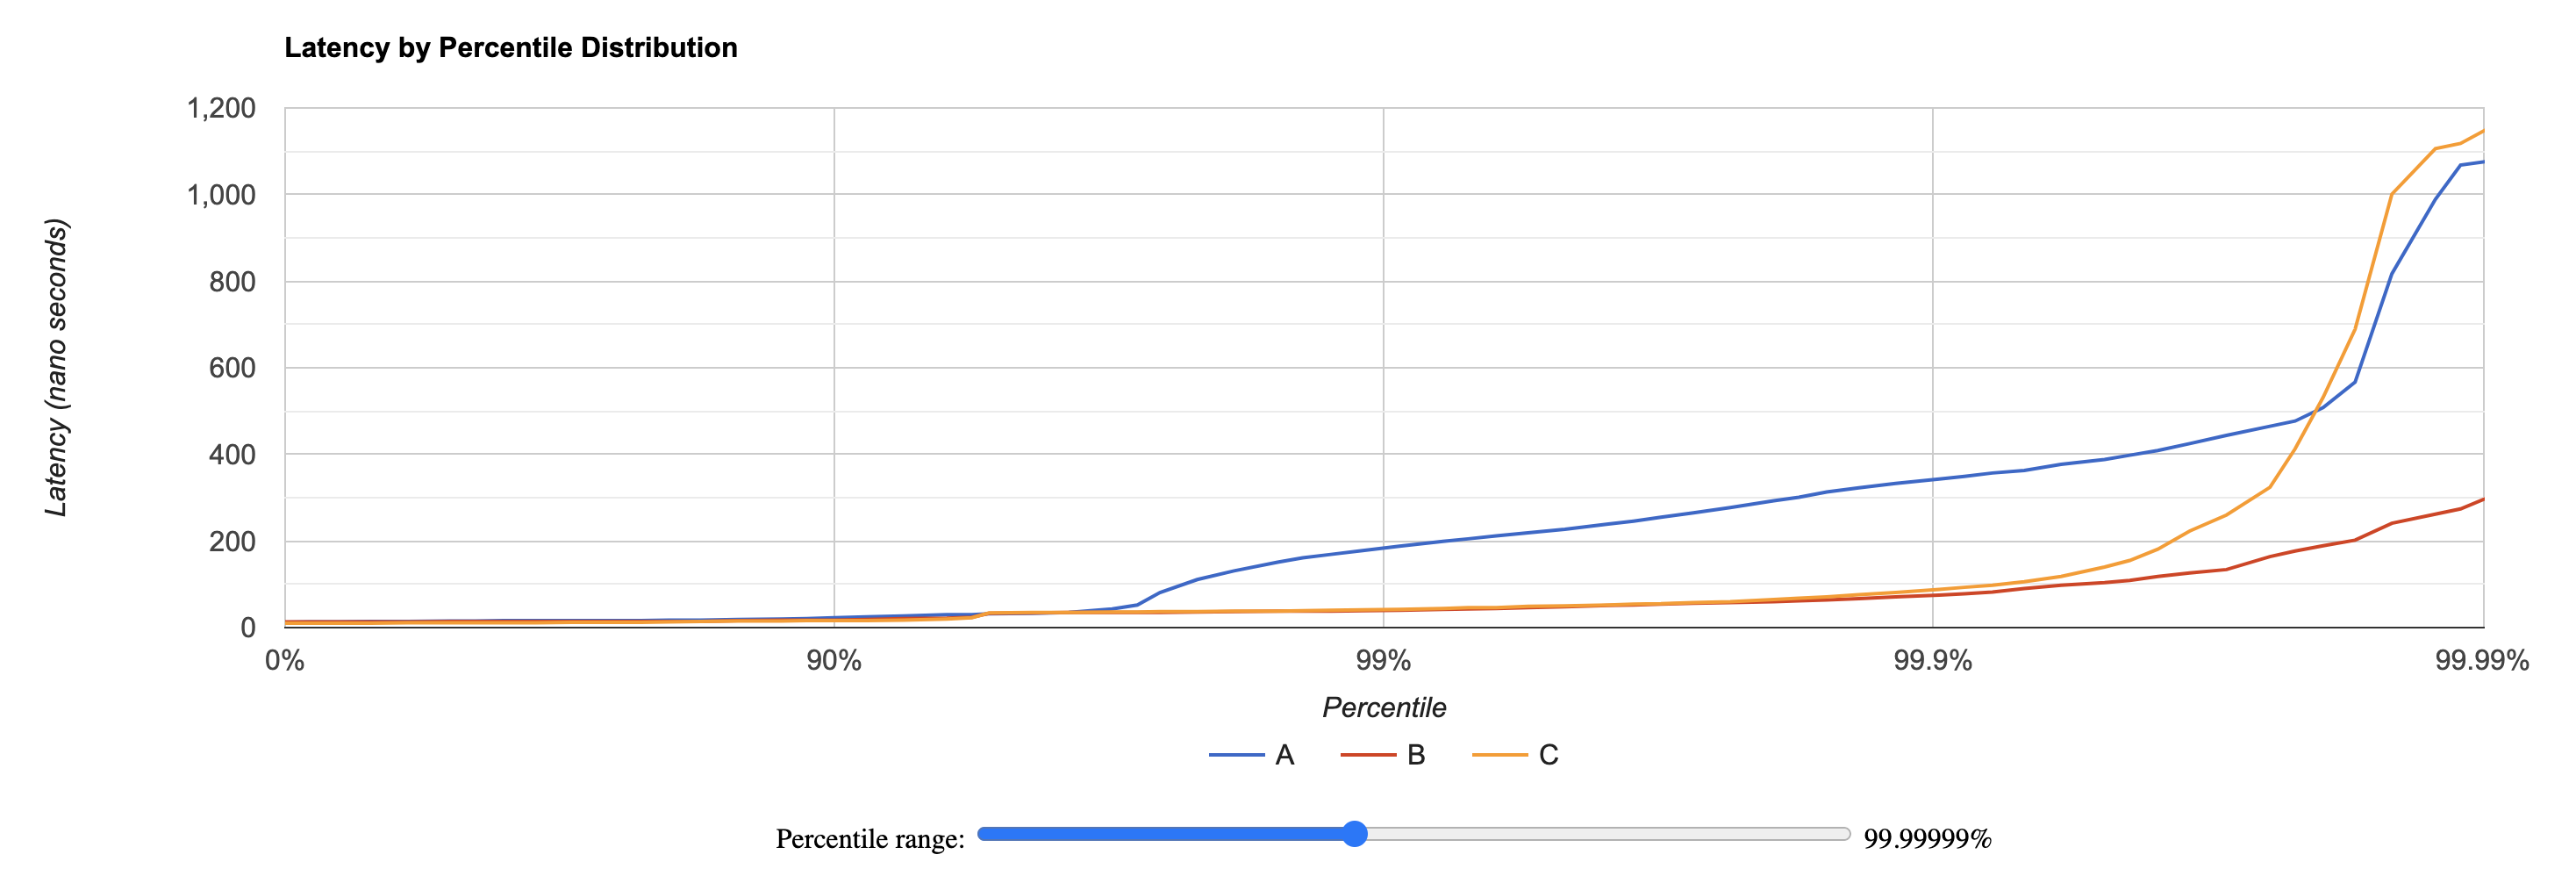
If you are in a hurry, you can generate an URL containing the histogram(s) you want to plot as a base64 url encoded string(s). The URL should look like the one below:
`https://hdrhistogram.github.io/HdrHistogramWidget?unitText=${"ms"}&data.name=${"HISTFAAAA..."}&data.other_name=${"HISTFAAAA..."}`;
Here is a working example
Writing some code
This library is packaged as a UMD module, hence you can use it directly
from JavaScript within a browser. To do so, you can simply include the bundle file from github's release page:
<script src="https://github.com/HdrHistogram/HdrHistogramWidget/releases/download/1.0.1/hdr-histogram-widget.umd.js"></script>
If you prefer using npm:
npm i hdr-histogram-widget
Then you can use the HdrHistogramWidget class which provides a convenient static method display():
import HdrHistogramWidget from "hdr-histogram-widget";
HdrHistogramWidget.display("HISTFAAAATR42i1M...");
You need to provide a base64 encoded histogram to this display() method.
If you need to display several histograms, you need to provide an object as shown below:
HdrHistogramWidget.display({
  "Latencies for option1": "HISTFAAAATR42i1M...",
  "Latencies for option2": "HISTFAAAAXt42i1O...",
  "Latencies for option3": "HISTFAAAAXt42i1O...",
});
By default the graph is displayed within the body of the page and the unit is 'milliseconds'. If the default behavior does not fit your needs, you can use two optionnal parameters:
const data = {
'Latencies for option1': 'HISTFAAAATR42i1M...',
...
}
HdrHistogramWidget.display(
data,
'nano seconds',
document.getElementById("graph")
);