Introduction
HiGlass is a web-based viewer for datasets too large to view at once.
It features synchronized navigation of multiple views as well as continuous zooming and panning
for navigation across genomic loci and resolutions. It supports visual comparison of
genomic (e.g., Hi-C, ChIP-seq, or bed annotations) and other data (e.g., geographic maps, gigapixel images, or abstract 1D and 2D sequential data) from different experimental conditions and can be used to efficiently
identify salient outcomes of experimental perturbations, generate new hypotheses, and share
the results with the community.
A live instance can be found at http://higlass.io. A Docker container is available for running an instance locally, although we recommend using the higlass-manage package to start, stop and configure local instances.
For documentation about how to use and install HiGlass, please visit http://docs.higlass.io.
Citation
Kerpedjiev, P., Abdennur, N., Lekschas, F., McCallum, C., Dinkla, K., Strobelt, H., ... & Gehlenborg, N. HiGlass: Web-based Visual Exploration and Analysis of Genome Interaction Maps. Genome Biology (2018): 19:125. https://doi.org/10.1186/s13059-018-1486-1
Example

Development
To run higlass from its source code simply run the following:
npm clean-install
npm run start
This starts a server in development mode at http://localhost:8080/.
Once started, a list of the examples can be found at http://localhost:8080/examples.html.
Template viewconfs located at /docs/examples/viewconfs can viewed directly at urls such as http://localhost:8080/apis/svg.html?/viewconfs/overlay-tracks.json.
Tests
The tests for the React components and API functions are located in the test directory. To save time and only run relevant tests, open karma.conf.js and select the test files to run before running test-watch.
npm run test-watch
Troubleshooting:
API
HiGlass provides an API for controlling the component from with JavaScript. Below is a minimal working example to get started and the complete documentation is availabe at docs.higlass.io.
<!DOCTYPE html>
<head>
<meta charset="utf-8">
<title>Minimal Working Example · HiGlass</title>
<link rel="stylesheet" href="https://maxcdn.bootstrapcdn.com/bootstrap/3.3.7/css/bootstrap.min.css">
<link rel="stylesheet" href="https://unpkg.com/higlass@1.6.6/dist/hglib.css">
<style type="text/css">
html, body {
width: 100vw;
height: 100vh;
overflow: hidden;
}
</style>
<script crossorigin src="https://unpkg.com/react@16/umd/react.production.min.js"></script>
<script crossorigin src="https://unpkg.com/react-dom@16/umd/react-dom.production.min.js"></script>
<script crossorigin src="https://unpkg.com/pixi.js@5/dist/pixi.min.js"></script>
<script crossorigin src="https://unpkg.com/react-bootstrap@0.32.1/dist/react-bootstrap.min.js"></script>
<script crossorigin src="https://unpkg.com/higlass@1.6.6/dist/hglib.min.js"></script>
</head>
<body></body>
<script>
const hgApi = window.hglib.viewer(
document.body,
'https://higlass.io/api/v1/viewconfs/?d=default',
{ bounded: true },
);
</script>
</html>
Related
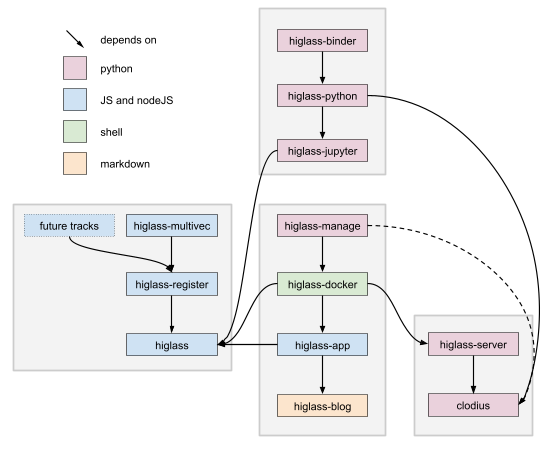
- HiGlass Clodius - Package that provides implementations for aggregation and tile generation for many common 1D and 2D data types
- HiGlass Python - Python bindings to the HiGlass for tile serving, view config generation, and Jupyter Notebook + Lab integration.
- HiGlass Manage - Easy to use interface for deploying a local HiGlass instance
- HiGlass Docker - Build an image containing all the components necessary to deploy HiGlass
- HiGlass Server - Server component for serving multi-resolution data
- HiGlass App - The code for the web application hosted at http://higlass.io
- Cooler - Package for efficient storage of and access to sparse 2D data
License
HiGlass is provided under the MIT License.
v1.9.1
- Used stretchRects to ensure that there are no rendering artifacts when zooming in too far
- Added scaled as a potential value to the annotationHeight option
- Added the maxAnnotationHeight option to limit the size of annotations when using the scaled option for annotationHeight
- Added the fontSize option for bedlike tracks
- colorAnnotations are independent of valueScale
- Vertical zooming on BedLike annotations
- Added support for aggregation of
horizontal-multivec rows by passing arrays of row indices to the selectRows option. With this addition also comes the track options selectRowsAggregationMode (for specifying an aggregation function, "mean", "sum", "variance", "deviation") and selectRowsAggregationWithRelativeHeight (boolean) to determine whether rows representing groups of indices have 1-unit heights or group.length-unit heights.
- Added the JS API
.on('wheel', callback) option for subscribing to mouse wheel events.
Detailed changes since v1.9.0