Homebridge Prometheus Exporter


What if we could store homebridge metrics in Prometheus
homebridge-prometheus-exporter is a plugin for homebridge that provides a metrics endpoint for Prometheus to scrape.
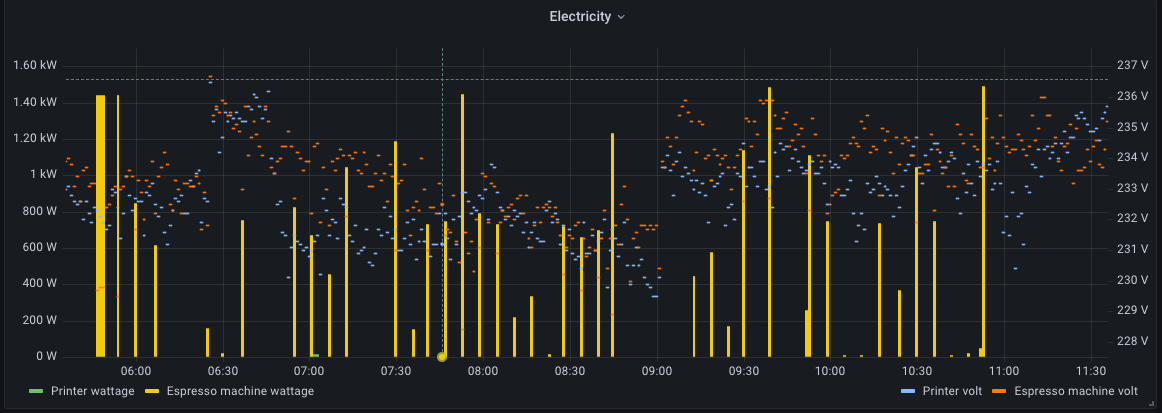
Once the metrics are in Prometheus, they can be consumed and presented in various ways. One can use Prometheus
Alerting Rules to trigger actions on certain thresholds or Grafana to build informative graphs or alerts.
Installing
Install the plugin
Run this command to install the plugin as a global nodejs module:
npm install -g homebridge-prometheus-exporter
Configure homebridge
Edit the homebridge config.json to load the plugin:
{
"platforms": [
{
"platform": "PrometheusExporter",
"pin": "123-12-123",
},
]
}
Customize homebridge startup
For homebridge-prometheus-exporter to work, homebridge has to run in "insecure mode". This means that any user who
has access to your network can control your homebridge devices. This is usually not a big problem but it is still
something you should consciously decide. homebridge-config-ui-x
requires running in insecure mode
if you want to control your devices from homebridge-config-ui-x.
To enable "insecure mode", edit the startup script for homebridge and add --insecure or -I. Assuming you run
systemd, the proper way to override the config would be to use systemd’s drop-in mechanism.
Create /etc/systemd/system/homebridge.service.d folder:
mkdir /etc/systemd/system/homebridge.service.d
Write this drop-in configuration file to /etc/systemd/system/homebridge.service.d/insecure.conf:
[Service]
ExecStart=
ExecStart=/usr/lib/node_modules/homebridge/bin/homebridge --insecure
The first and empty ExecStart tells systemd to forget about the ExecStart from the original service definition
and the second ExecStart declares the new file. Run systemctl daemon-reload to refresh systemd’s unit database
and then run systemd-delta --type=extended to check if the drop-in worked as expected.
You should see something like this in the output:
…
[EXTENDED]   /lib/systemd/system/homebridge.service → /etc/systemd/system/homebridge.service.d/insecure.conf
…
If you are not using systemd, first of all, you absolutely should but second of all you will likely have some sort
of env file, e.g. /etc/defaults/homebridge to customize the homebridge start command. Restart homebridge using
systemctl restart homebridge.
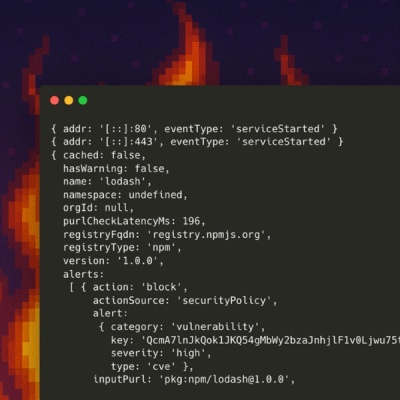
Test that the metrics endpoint is available by accesing http://homebridge-host:36123/metrics. You should see a
response similar to this:
# TYPE homebridge_air_purifier_active gauge
homebridge_air_purifier_active{name="…",…} 0 1667914208196
# TYPE homebridge_air_purifier_current_air_purifier_state gauge
homebridge_air_purifier_current_air_purifier_state{name="…",…} 0 1667914208196
Configuring Prometheus
With homebridge-prometheus-exporter up and running, it is now time to configure Prometheus to scrape the config
endpoint. Go to your prometheus host and edit /etc/prometheus/prometheus.yml and add the following scrape config:
scrape_configs:
  - job_name: homebridge-exporter
    static_configs:
    - targets:
      - homebridge-host:36123
Once Prometheus is restarted, metrics with the homebridge_ prefix should start to be ingested.
Customize homebridge-prometheus-exporter
homebridge-prometheus-exporter offers a few advanced settings to customize its behavior.
{
  // ...
  "platforms": [
    {
      "platform": "PrometheusExporter",


      // Pin
      //
      // Homebridge PIN for service authentication
      "pin": "<string>",


      // Debug
      //
      // Default: false
      "debug": "<boolean>",


      // Metrics prefix
      //
      // Default: "homebridge"
      "prefix": "<string>",


      // Metrics server port
      //
      // TCP port where the Prometheus metrics server listens
      //
      // Default: 36123
      "port": "<integer>",


      // Metrics server interface
      //
      // Interface where the Prometheus metrics server listens. Can be an IP, a
      // hostname, "0.0.0.0" for all IPv4 interfaces, "::1" for all IPv6 interfaces.
      // Default is "::" which means "any interface"
      //
      // Default: "::"
      "interface": "<string>",


      // Service refresh interval
      //
      // Discover new services every <interval> seconds
      //
      // Default: 60
      "refresh_interval": "<integer>",


      // Request timeout
      //
      // Request timeout when interacting with homebridge instances
      //
      // Default: 10
      "request_timeout": "<integer>",


      // Service discovery timeout
      //
      // Discovery timeout after which the current discovery is considered failed
      //
      // Default: 20
      "discovery_timeout": "<integer>",


      // TLS cert file
      //
      // Path to TLS certificate file (in PEM format)
      "tls_cert_file": "<string>",


      // TLS key file
      //
      // Path to TLS key file
      "tls_key_file": "<string>",


      // Basic auth username/password pairs
      //
      // Usernames and passwords for basic auth. Object key is the username, object
      // value is the password. Password must be encoded with bcrypt. Example:
      // {"joanna": "$2a$12$5/mmmRB28wg9yzaXhee5Iupq3UrFr/qMgAe9LvAxGoY5jLcfVGTUq"}
      "basic_auth": "<object>"
    }
  ]
}