Product
Introducing Rust Support in Socket
Socket now supports Rust and Cargo, offering package search for all users and experimental SBOM generation for enterprise projects.
lengoo-logger
Advanced tools
Lengoo logger is a small wrapper of winston logger tailored to the team needs.
By default when used in development, it logs the defined events to the standard output, in production or staging, it can be connected to an elasticsearch instance and log pre-formatted logs to be visualized with Kibana and APM logs for keeping tracks of possible failures coming from the service itself (e.g. Connectivity issues with another service).
To install this package is enough to execute:
npm install --save lengoo-logger
Or for yarn users:
yarn add lengoo-logger
In order to make features such APM or elasticsearch logs indexing, some configuration has to be provided in the form of environment variables, an example is as following:
APM_SERVER="http://localhost:8200"
ES_HOST="http://localhost:9200"
If some of the previous mentioned variables is not defined, the belonging service will not be activated
As mentioned before, all the configuration is managed by environment variables, there are some optionals and some other mandatories for the correct working of the library:
APP_ENV=development # Can be either dev, development, stage, staging, prod, production
NODE_ENV=APP_ENV # (if you use this one, don't use APP_ENV, this could create overlaps in the configuration)
APP_NAME=<app_name> # mandatory, will define the name of the logs in the index.
APM_SERVER="http://localhost:8200" # optional, if not defined, will not connect to an APM server.
ES_HOST="http://localhost:9200" # optional, if not defined, will not connect to an Elasticsearch instance.
In order to use this library, you should import it first:
const Logger = require('lengoo-logger');
There are different levels of logging that are defined by the severity of the event you want to log, in this package, the severity levels are being kept from winston, and are the following:
const levels = {
  error: 0,
  warn: 1,
  info: 2,
  verbose: 3,
  debug: 4,
  silly: 5
};
Being each key a method in the package, you can log by calling them:
Logger.error('This is a message');
Each method contained by the package accepts either a string or an object, so it is possible to do something like:
Logger.error('This is an error message');
// or
Logger.error({
  code: 'not-found',
  message: 'Not Found',
  trace: err.stack.toString(),
})
In the first case, the resulting log will contain the following structure:
{
  "@timestamp": "2019-01-16T11:32:03.555Z",
  "message": "This is an error message",
  "severity": "error",
}
In the second case, you will have a little bit more complex structure:
{
  "@timestamp": "2019-01-16T11:32:03.555Z",
    "message": "Not found",
    "severity": "error",
    "fields": {
      "metadata": {
        "code": "not-found",
        "trace": "at hello_world.js line 1",
        "timestamp": "2019-01-16T11:32:03.552Z"
      }
    }
}
If you notice, you will always have consistency with timestamp, message and severity in the resulting log structure, and if you need to add extra data to the log, you can do it and this will be stored in a metadata field located inside fields object, this is meant for elasticsearch to keep consistency accross indices.
FAQs
Small winston wrapper tailored to lengoo needs
We found that lengoo-logger demonstrated a not healthy version release cadence and project activity because the last version was released a year ago. It has 1 open source maintainer collaborating on the project.
Did you know?

Socket for GitHub automatically highlights issues in each pull request and monitors the health of all your open source dependencies. Discover the contents of your packages and block harmful activity before you install or update your dependencies.

Product
Socket now supports Rust and Cargo, offering package search for all users and experimental SBOM generation for enterprise projects.

Product
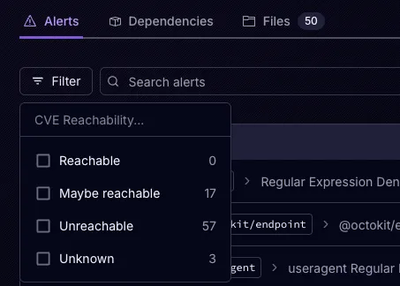
Socket’s precomputed reachability slashes false positives by flagging up to 80% of vulnerabilities as irrelevant, with no setup and instant results.

Product
Socket is launching experimental protection for Chrome extensions, scanning for malware and risky permissions to prevent silent supply chain attacks.