You're Invited:Meet the Socket Team at BlackHat and DEF CON in Las Vegas, Aug 4-6.RSVP →
loopback-component-visualizer
Advanced tools
loopback-component-visualizer - npm Package Compare versions
Comparing version 1.0.2 to 1.1.0
14
index.js
@@ -9,3 +9,3 @@ 'use strict'; | ||
| options = _defaults({}, options, { | ||
| mountPath: '/visualize' | ||
| mountPath: '/visualize', | ||
| }); | ||
@@ -45,10 +45,11 @@ loopbackApp.use(options.mountPath, createDiagram(loopbackApp, options)); | ||
| if (modelDefinition && modelDefinition.properties) { | ||
| var propString = Object.keys(modelDefinition.properties).toString().split(",").join('<li>'); | ||
| var propString = Object.keys(modelDefinition.properties).toString().split(',').join('<li>'); | ||
| var propObj = {}; | ||
| propObj.id = idx; | ||
| propObj.name = Model.modelName; | ||
| propObj.props = propString; | ||
| propObj.label = Model.modelName; | ||
| propObj.props = '<ul><li>' + Object.keys(modelDefinition.properties).toString().split(',').join('<li>\n').replace('"', '') + '</ul>'; | ||
| propObj.level = level; | ||
| propObj.remotes = remotes && remotes.toString().split(',').join('<li>'); | ||
| propObj.remotes = remotes && '<ul><li>' + remotes.toString().split(',').join('<li>\n').replace('"', '') + '</ul>'; | ||
| propObj.title = '<h2>' + propObj.label + '</h2><h3>Props:</h3>\n' + propObj.props + '\n<h3>Remotes:</h3>' + propObj.remotes | ||
| propArr.push(propObj); | ||
@@ -69,2 +70,5 @@ x++; | ||
| edgeObj.to = modIdxObj[Model.settings.relations[relArr[rel]].model]; | ||
| edgeObj.label = relArr[rel] || ''; | ||
| edgeObj.title = JSON.stringify(Model.settings.relations[relArr[rel]]); | ||
| edgeObj.arrows = 'to'; | ||
| edgeArr.push(edgeObj); | ||
@@ -71,0 +75,0 @@ } |
| { | ||
| "name": "loopback-component-visualizer", | ||
| "version": "1.0.2", | ||
| "version": "1.1.0", | ||
| "description": "Loopback component to visualize models and their relationships", | ||
@@ -5,0 +5,0 @@ "main": "./index.js", |
@@ -7,6 +7,5 @@ # loopback-component-visualizer | ||
| Visualizing a model is sometimes a difficult task. Its becomes more worse when the data model gets larger, | ||
| trying to understand how models relate to eachother. | ||
| Visualizing a model is sometimes a difficult task. When the data model gets larger, it becomes even more difficult to understand how models relate to each other. | ||
| loopback-component-visualizer helps you in creating a model diagram with the relation for you loopback application. | ||
| loopback-component-visualizer helps you in creating a model diagram with a representation of all the properties, methods and relationships of your models for your loopback application. | ||
@@ -19,4 +18,6 @@ ### Table of contents | ||
| Install the module in your loopback application folder. | ||
| ```sh | ||
| $ npm install loopback-component-visualizer | ||
| $ npm install loopback-component-visualizer --save | ||
| ``` | ||
@@ -38,2 +39,2 @@ | ||
|  | ||
| 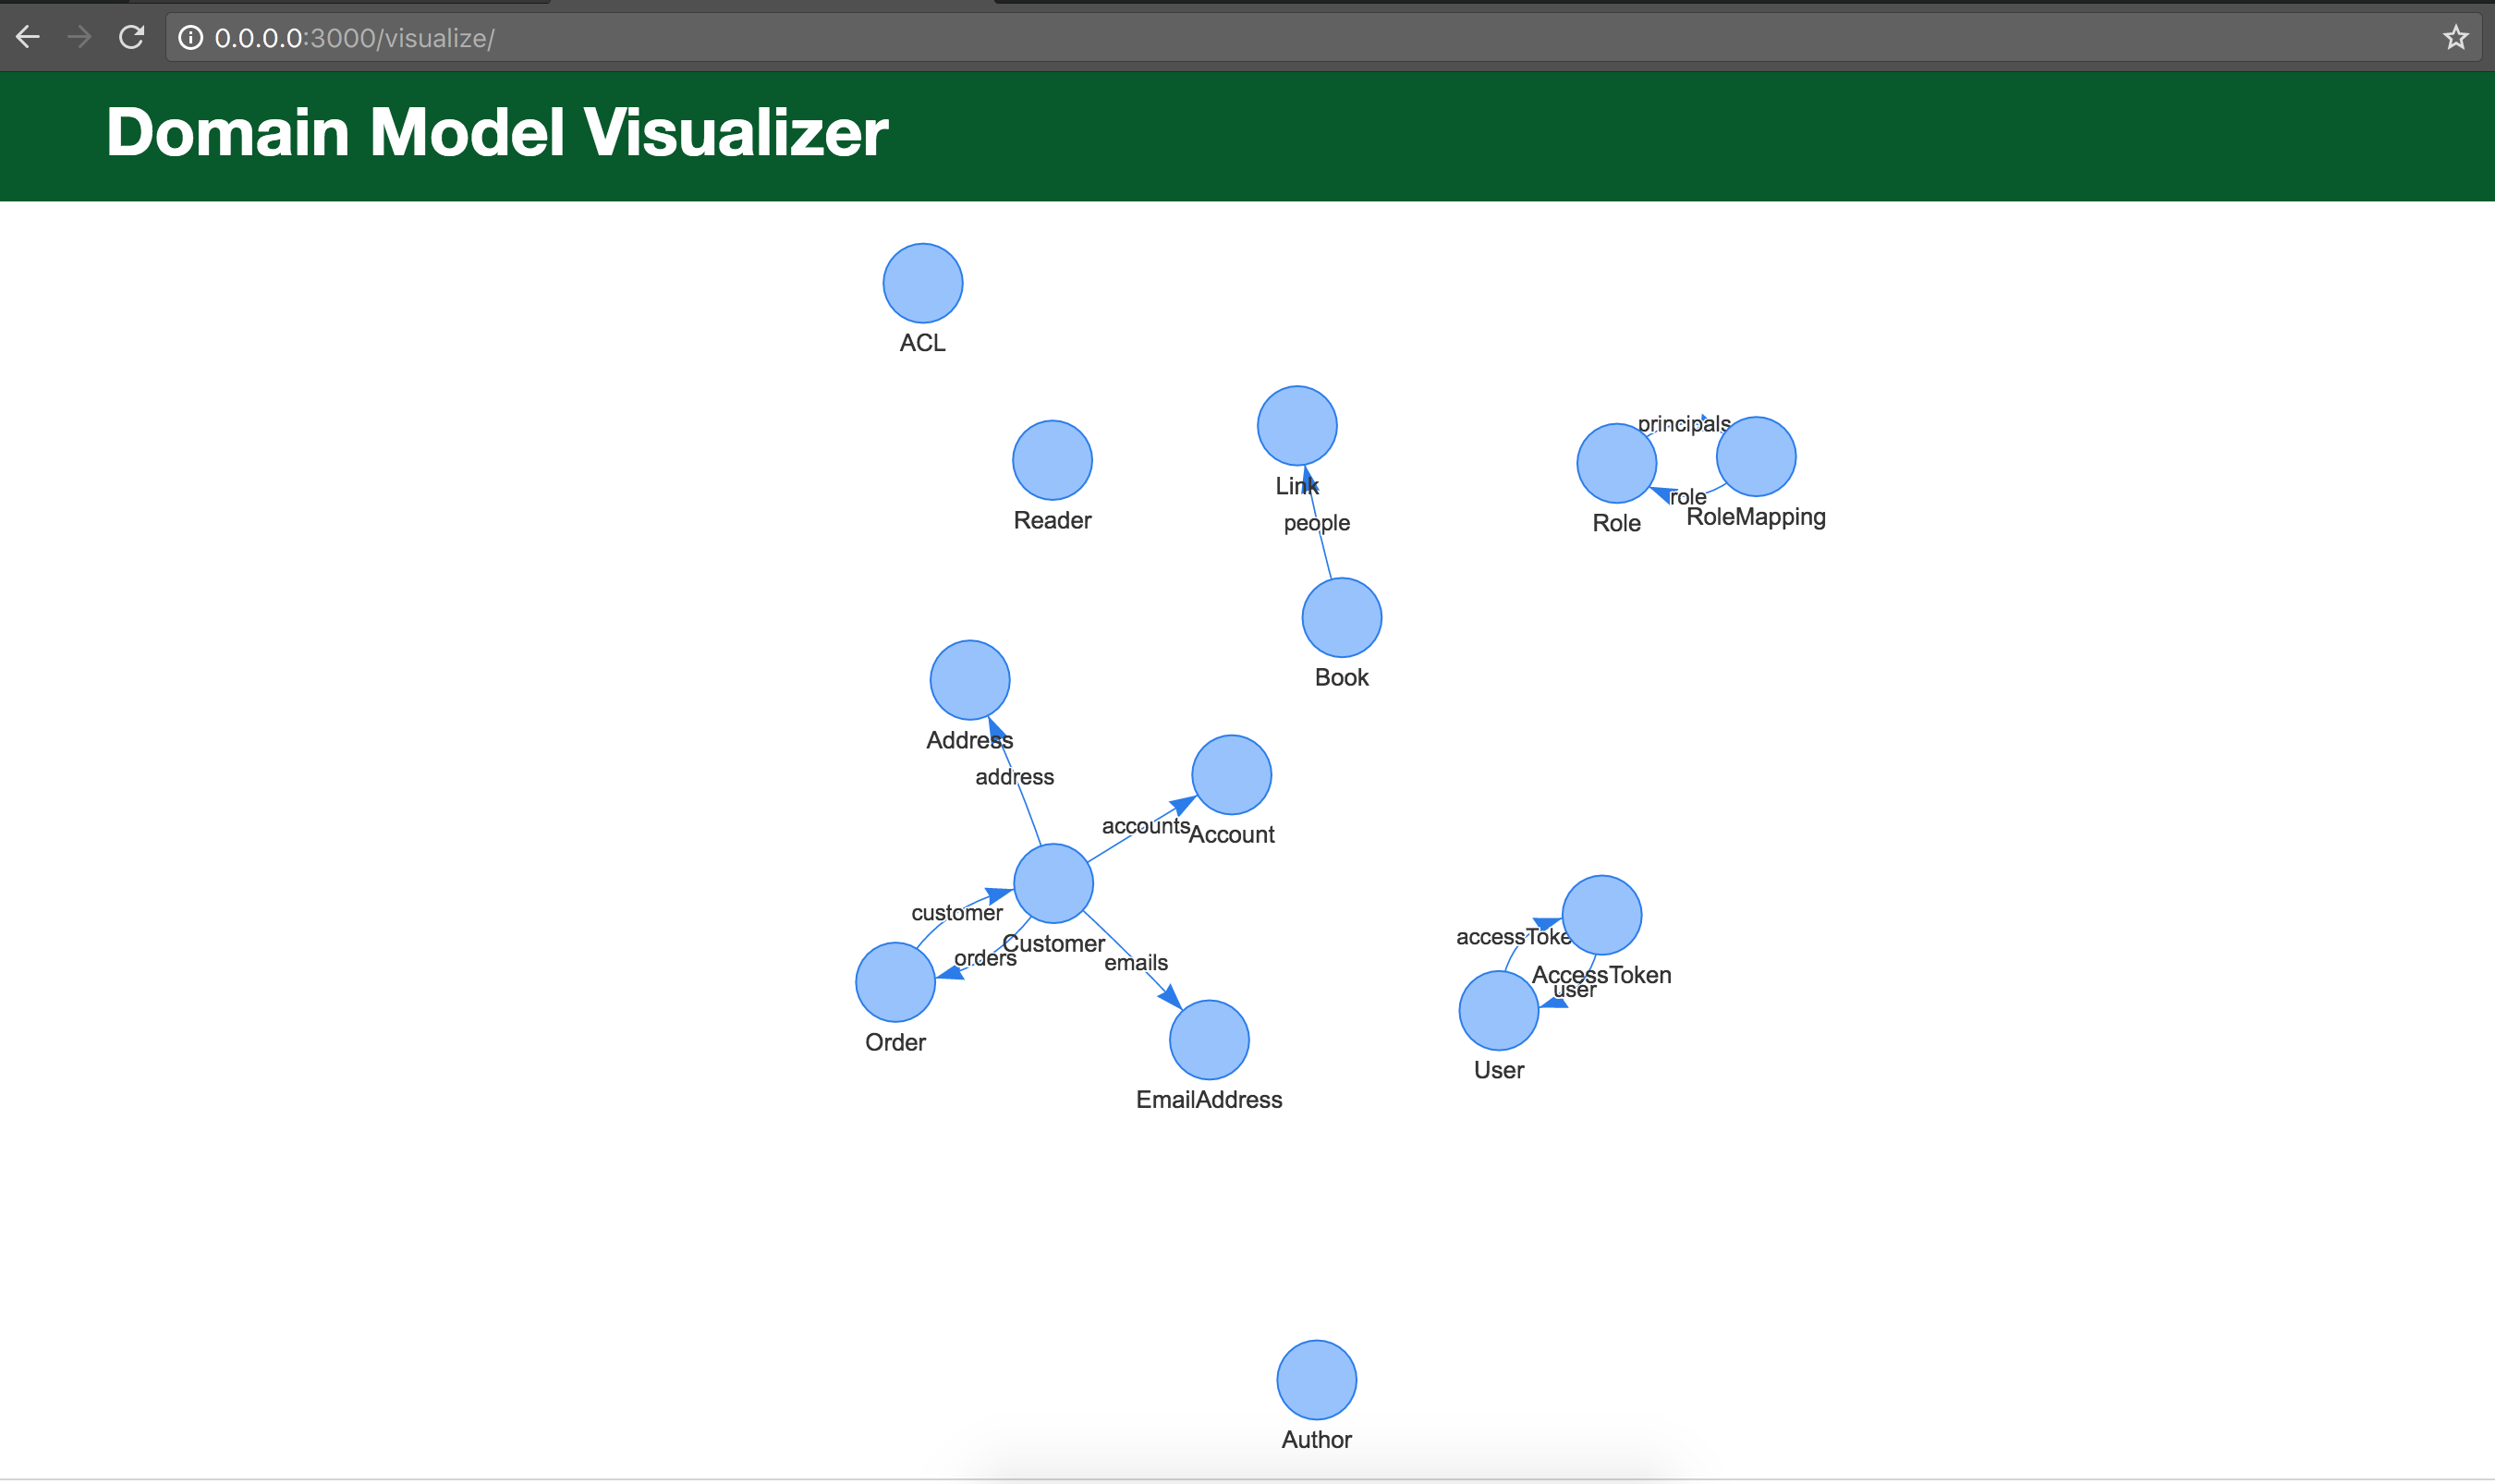 |
@@ -58,4 +58,4 @@ var loopback = require('loopback'); | ||
| expect(finalObj.nodes).to.have.lengthOf(2); | ||
| expect(finalObj.nodes[0]).to.contain.all.keys({'name': 'Address'}); | ||
| expect(finalObj.nodes[0]).to.contain.all.keys({'name': 'Customer'}); | ||
| expect(finalObj.nodes[0]).to.contain.all.keys({'label': 'Address'}); | ||
| expect(finalObj.nodes[0]).to.contain.all.keys({'label': 'Customer'}); | ||
| done(); | ||
@@ -62,0 +62,0 @@ }); |
Sorry, the diff of this file is not supported yet
Sorry, the diff of this file is not supported yet
No alert changes
Improved metrics
- Total package byte prevSize
255663
365.78%- Lines of code
203
2.01%- Number of lines in readme file
38
2.7%No dependency changes