Security News
Feross on Risky Business Weekly Podcast: npm’s Ongoing Supply Chain Attacks
Socket CEO Feross Aboukhadijeh joins Risky Business Weekly to unpack recent npm phishing attacks, their limited impact, and the risks if attackers get smarter.
A node.js port of codahale's metrics library: https://github.com/codahale/metrics
Metrics provides an instrumentation toolkit to measure the behavior of your critical systems while they're running in production.
The MIT License (MIT) Copyright (c) 2012 Mike Ihbe
Permission is hereby granted, free of charge, to any person obtaining a copy of this software and associated documentation files (the "Software"), to deal in the Software without restriction, including without limitation the rights to use, copy, modify, merge, publish, distribute, sublicense, and/or sell copies of the Software, and to permit persons to whom the Software is furnished to do so, subject to the following conditions:
The above copyright notice and this permission notice shall be included in all copies or substantial portions of the Software.
THE SOFTWARE IS PROVIDED "AS IS", WITHOUT WARRANTY OF ANY KIND, EXPRESS OR IMPLIED, INCLUDING BUT NOT LIMITED TO THE WARRANTIES OF MERCHANTABILITY, FITNESS FOR A PARTICULAR PURPOSE AND NONINFRINGEMENT. IN NO EVENT SHALL THE AUTHORS OR COPYRIGHT HOLDERS BE LIABLE FOR ANY CLAIM, DAMAGES OR OTHER LIABILITY, WHETHER IN AN ACTION OF CONTRACT, TORT OR OTHERWISE, ARISING FROM, OUT OF OR IN CONNECTION WITH THE SOFTWARE OR THE USE OR OTHER DEALINGS IN THE SOFTWARE.
Import Metrics
metrics = require('metrics');
Start a metrics Server
var metricsServer = new metrics.Server(config.metricsPort || 9091);
Servers are only one way to report your metrics. It's actually a thin layer on top of metrics.Report, which you could use to build other reporting mechanisms.
Add the metrics to the server
metricsServer.addMetric('com.co.thingA', counter);
metricsServer.addMetric('com.co.thingB', hist1);
metricsServer.addMetric('com.co.thingC', hist2);
metricsServer.addMetric('com.co.thingD', meter);
metricsServer.addMetric('com.co.thingE', timer);
Setting up a Reporter
A reporting interface exists for reporting metrics on a recurring interval. Reporters can be found in reporting/.
// Report to console every 1000ms.
var report = new metrics.Report();
report.addMetric('com.co.thingA', counter);
var reporter = new metrics.ConsoleReporter(report);

reporter.start(1000);
Typical production deployments have multiple node processes per server. Rather than each process exposing metrics on different ports, it makes more sense to expose the metrics from the "master" process. Writing a thin wrapper around this api to perform the process communication is trivial, with a message passing setup, the client processes could look something like this:
var Metric = exports = module.exports = function Metrics(messagePasser, eventType) {
  this.messagePasser = messagePasser;
  this.eventType = eventType;
}

Metric.prototype.newMetric = function(type, eventType) {
  this.messagePasser.sendMessage({
    method: 'createMetric'
    , type: type
    , eventType: eventType
  });
}
Metric.prototype.forwardMessage = function(method, args) {
  this.messagePasser.sendMessage({
    method: 'updateMetric'
    , metricMethod: method
    , metricArgs: args
    , eventType: this.eventType
  });
}

Metric.prototype.update = function(val) { return this.forwardMessage('update', [val]); }
Metric.prototype.mark = function(n) { return this.forwardMessage('mark', [n]); }
Metric.prototype.inc = function(n) { return this.forwardMessage('inc', [n]); }
Metric.prototype.dec = function(n) { return this.forwardMessage('dec', [n]); }
Metric.prototype.clear = function() { return this.forwardMessage('clear'); }
And the server side that receives the createMetric and updateMetric rpcs could look something like this:
{
  createMetric: function(msg) {
      if (metricsServer) {
        msg.type = msg.type[0].toUpperCase() + msg.type.substring(1)
        metricsServer.addMetric(msg.eventType, new metrics[msg.type]);
      }
   }
  updateMetric: function(msg) {
    if (metricsServer) {
    var namespaces = msg.eventType.split('.')
      , event = namespaces.pop()
      , namespace = namespaces.join('.');
    var metric = metricsServer.trackedMetrics[namespace][event];
    metric[msg.metricMethod].apply(metric, msg.metricArgs);
  }
}
For multiple server deployments, you have more options, but the best approach will be highly application dependent. Best of luck, and always be tracking! Using the metrics server you can hit the server on your configured port and you'll get a json representation of your metrics. You should collect these periodically to generate timeseries to monitor the longterm health of your application. The metrics.Reporting object would let you write to a log periodically or however else you'd like to expose your metrics.
FAQs
A node.js port of Coda Hale's metrics library. In use at Yammer.
We found that metrics demonstrated a not healthy version release cadence and project activity because the last version was released a year ago. It has 2 open source maintainers collaborating on the project.
Did you know?

Socket for GitHub automatically highlights issues in each pull request and monitors the health of all your open source dependencies. Discover the contents of your packages and block harmful activity before you install or update your dependencies.

Security News
Socket CEO Feross Aboukhadijeh joins Risky Business Weekly to unpack recent npm phishing attacks, their limited impact, and the risks if attackers get smarter.

Product
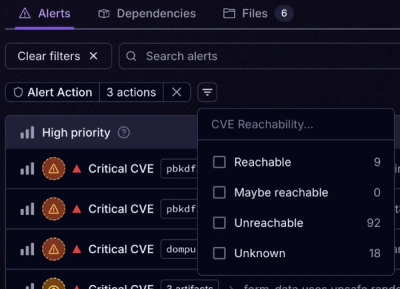
Socket’s new Tier 1 Reachability filters out up to 80% of irrelevant CVEs, so security teams can focus on the vulnerabilities that matter.

Research
/Security News
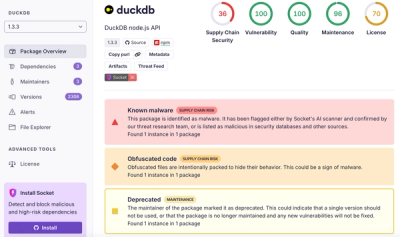
Ongoing npm supply chain attack spreads to DuckDB: multiple packages compromised with the same wallet-drainer malware.