
Research
Two Malicious Rust Crates Impersonate Popular Logger to Steal Wallet Keys
Socket uncovers malicious Rust crates impersonating fast_log to steal Solana and Ethereum wallet keys from source code.
By Kirill Boychenko - Sep 24, 2025
mini-graph-card
Advanced tools
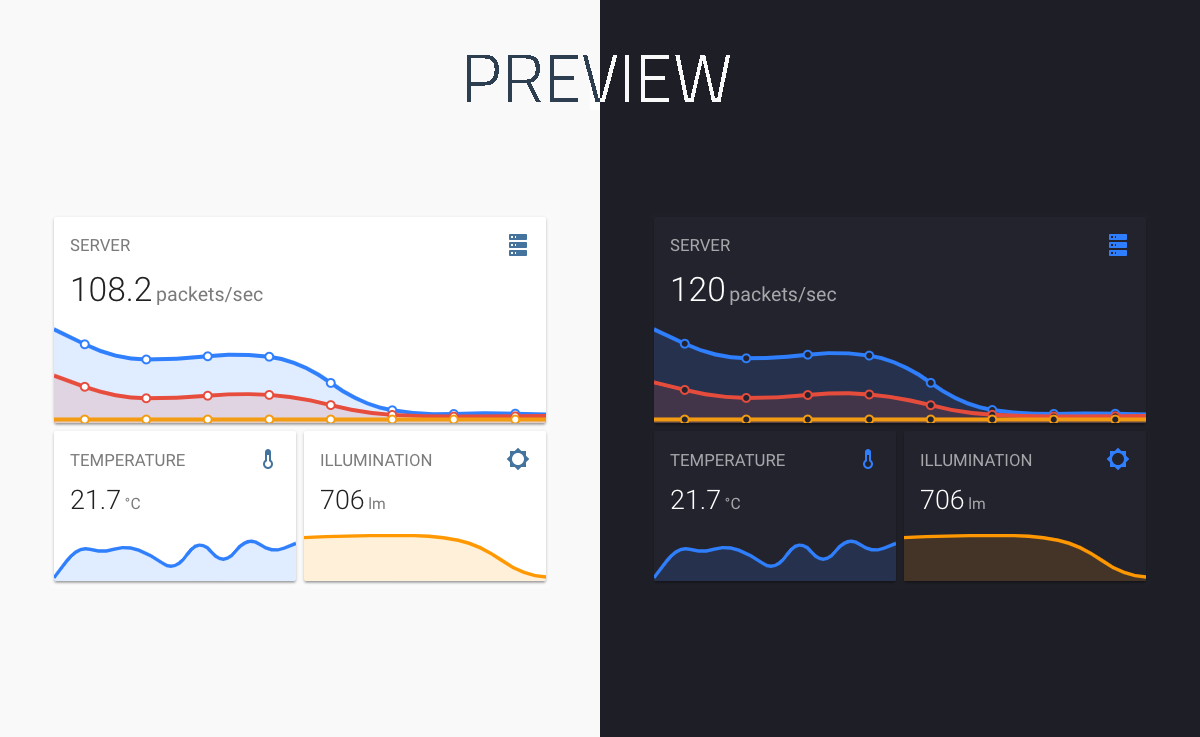
A minimalistic and customizable graph card for Home Assistant Lovelace UI
A minimalistic and customizable graph card for Home Assistant Lovelace UI.
The card works with entities from within the sensor domain and displays the sensors current state as well as a line graph representation of the history.
Download and copy mini-graph-card-bundle.js from the latest release into your config/www directory.
Add a reference to mini-graph-card-bundle.js inside your ui-lovelace.yaml.
resources:
  - url: /local/mini-graph-card-bundle.js?v=0.2.1
    type: module
Move into your config/www directory
Grab mini-graph-card-bundle.js
$ wget https://github.com/kalkih/mini-graph-card/releases/download/v0.2.1/mini-graph-card-bundle.js
mini-graph-card-bundle.js inside your ui-lovelace.yaml.resources:
- url: /local/mini-graph-card-bundle.js?v=0.2.1
type: module
Make sure you've the custom_updater component installed and working.
Add a new reference under card_urls in your custom_updater configuration in configuration.yaml.
custom_updater:
card_urls:
- https://raw.githubusercontent.com/kalkih/mini-graph-card/master/tracker.json
If you have a version older than v0.0.8 installed, please delete the current files and follow the installation instructions again.
Find your mini-graph-card-bundle.js file in config/www or wherever you ended up storing it.
Replace the local file with the latest one attached in the latest release.
Add the new version number to the end of the cards reference url in your ui-lovelace.yaml like below.
resources:
  - url: /local/mini-graph-card-bundle.js?v=0.2.1
    type: module
You may need to empty the browsers cache if you have problems loading the updated card.
| Name | Type | Default | Since | Description |
|---|---|---|---|---|
| type | string | required | v0.0.1 | custom:mini-graph-card. |
| entities | string/list | required | v0.0.1 | Single entity id as a string or multiple entities in a list, see entities object for additional entity options. |
| icon | string | optional | v0.0.1 | Set a custom icon from any of the available mdi icons. |
| name | string | optional | v0.0.1 | Set a custom name which is displayed beside the icon. |
| unit | string | optional | v0.0.1 | Set a custom unit of measurement. |
| more_info | boolean | true | v0.0.1 | Set to false to disable the "more info" dialog popup when pressing on the card. |
| group | boolean | false | v0.2.0 | Disable paddings and box-shadow, useful when nesting the card. |
| hours_to_show | integer | 24 | v0.0.2 | Specify how many hours the line graph should render. |
| points_per_hour | integer | 1 | v0.2.0 | Specify amount of data points the graph should render for every hour, (basically the detail/accuracy of the graph). |
| show | list | optional | v0.2.0 | List of UI elements to display/hide, for available items see available show options. |
| animate | boolean | false | v0.2.0 | Add a reveal animation to the graph. |
| height | number | 150 | v0.0.1 | Set a custom height of the line graph. |
| line_width | number | 5 | v0.0.1 | Set the thickness of the line. |
| line_color | string/list | var(--accent-color) | v0.0.1 | Set a custom color for the graph line, provide a list of colors for multiple graph entries. |
| decimals | integer | optional | v0.0.9 | Specify the exact number of decimals to show for states. |
| hour24 | boolean | false | v0.2.1 | Set to true to display times in 24-hour format. |
| font_size | number | 100 | v0.0.3 | Adjust the font size of the state displayed, as percentage of the original size. |
| align_header | string | default | v0.2.0 | Set the alignment of the header, left, right, center or default. |
| align_icon | string | right | v0.2.0 | Set the alignment of the icon, left, right or state. |
| align_state | string | left | v0.2.0 | Set the alignment of the current state, left, right or center. |
| line_color_above | list | optional | v0.2.0 | Set thresholds for different line graph colors, see Line color object. |
| line_color_below | list | optional | v0.2.0 | Set thresholds for different line graph colors, see Line color object. |
Providing options are optional, entities can be listed directly, see example below.
| Name | Type | Default | Description |
|---|---|---|---|
| entity | string | required | Entity id of the sensor. |
| name | string | optional | Set a custom display name, defaults to entity's friendly_name. |
| show_state | string | optional | Display the current state of the sensor. |
entities:
  - sensor.temperature
  - entity: sensor.pressure
    name: Pressure
    show_state: true
  - sensor.humidity
All options are optional.
| Name | Default | parameter | Description |
|---|---|---|---|
| name | true | true / false | Display name |
| icon | true | true / false | Display icon |
| state | true | true / false | Display current state |
| graph | true | true / false | Display the graph |
| fill | true | true / false | Display the graph fill |
| points | hover | true / false / hover | Display graph data points |
| legend | true | true / false | Display the graph legend (only shown when graph contains multiple entities) |
| extrema | false | true / false | Display max/min information |
| labels | false | true / false | Display Y-axis labels |
See adaptive line color for example usage.
| Name | Type | Default | Description |
|---|---|---|---|
| value | number | required | The threshold at where the color should apply if state is above/below. |
| color | string | required | Color to apply to line graph, most formats supported (hex, rgb, rgba or just the name of the color etc.) |
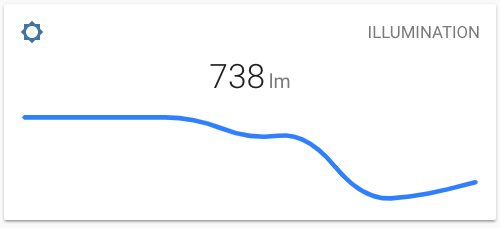
- type: custom:mini-graph-card
  entities: sensor.illumination
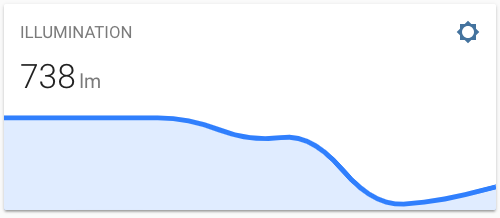
# Example
- type: custom:mini-graph-card
  entities: sensor.illumination
  location_icon: left
  location_state: center
  show:
    fill: false
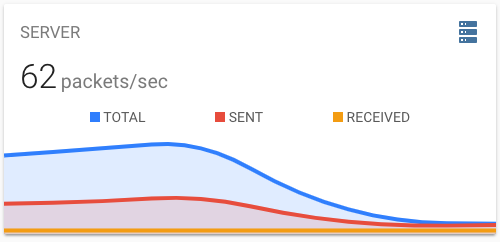
- type: custom:mini-graph-card
  name: SERVER
  icon: mdi:server
  entities:
    - entity: sensor.server_total
      name: TOTAL
    - sensor.server_sent
    - sensor.server_received
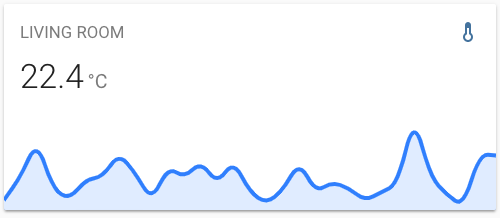
Use the hours_to_show option to specify how many hours of history the graph should represent.
Use the points_per_hour option to specify the accuracy/detail of the graph.
- type: custom:mini-graph-card
  entities: sensor.living_room_temp
  name: LIVONG ROOM
  hours_to_show: 168
  points_per_hour: 0.25
Use the show option to show/hide UI elements.
- type: custom:mini-graph-card
  entities: sensor.humidity
  show:
    icon: false
    name: false
    state: false
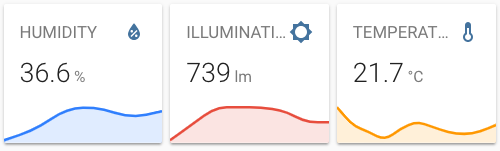
You can stack cards horizontally by using one or more horizontal-stack(s).
- type: horizontal-stack
  cards:
    - type: custom:mini-graph-card
      entities: sensor.humidity
      line_color: blue
      line_width: 8
      font_size: 75
    - type: custom:mini-graph-card
      entities: sensor.illumination
      line_color: '#e74c3c'
      line_width: 8
      font_size: 75
    - type: custom:mini-graph-card
      entities: sensor.temperature
      line_color: var(--accent-color)
      line_width: 8
      font_size: 75
Have the line color change with the current state.
When listing more than one color entry, place them in order from low -> high for line_color_above and high -> low for line_color_below.
- type: custom:mini-graph-card
  entities: sensor.sensor_temperature
  line_color_above:
    - value: 10
      color: yellow
    - value: 20
      color: orange
    - value: 30
      color: red
  line_color_below:
    - value: -10
      color: white
    - value: -20
      color: lightblue
    - value: -30
      color: blue
    - value: -50
      color: "#000000"
Clone this repository into your config/www folder using git.
$ git clone https://github.com/kalkih/mini-graph-card.git
Add a reference to the card in your ui-lovelace.yaml.
resources:
  - url: /local/mini-graph-card/mini-graph-card-bundle.js
    type: module
Requires nodejs & npm
Move into the mini-graph-card repo, checkout the dev branch & install dependencies.
$ cd mini-graph-card && git checkout dev && npm install
Edit the source, build by running
$ npm run build
The mini-graph-card-bundle.js will be rebuilt and ready.
For convenience, you can have the source build itself on file change by running
$ npm run watch
If you plan to submit a PR, please base it on the .dev` branch
Make sure you have javascript_version: latest in your configuration.yaml under frontend:.
Make sure you have the latest versions of mini-graph-card.js & mini-graph-lib.js.
If you have issues after updating the card, try clearing your browser cache.
If you have issues displaying the card in older browsers, try changing type: module to type: js at the card reference in ui-lovelace.yaml.
This project is under the MIT license.
v0.2.1
hour24 option to choose time format between 12-hour/24-hour clockshow_state option for the entity object (#33)FAQs
A minimalistic and customizable graph card for Home Assistant Lovelace UI
The npm package mini-graph-card receives a total of 2 weekly downloads. As such, mini-graph-card popularity was classified as not popular.
We found that mini-graph-card demonstrated a not healthy version release cadence and project activity because the last version was released a year ago. It has 1 open source maintainer collaborating on the project.
Did you know?

Socket for GitHub automatically highlights issues in each pull request and monitors the health of all your open source dependencies. Discover the contents of your packages and block harmful activity before you install or update your dependencies.
Research
Socket uncovers malicious Rust crates impersonating fast_log to steal Solana and Ethereum wallet keys from source code.

Research
A malicious package uses a QR code as steganography in an innovative technique.

Research
/Security News
Socket identified 80 fake candidates targeting engineering roles, including suspected North Korean operators, exposing the new reality of hiring as a security function.