Summary
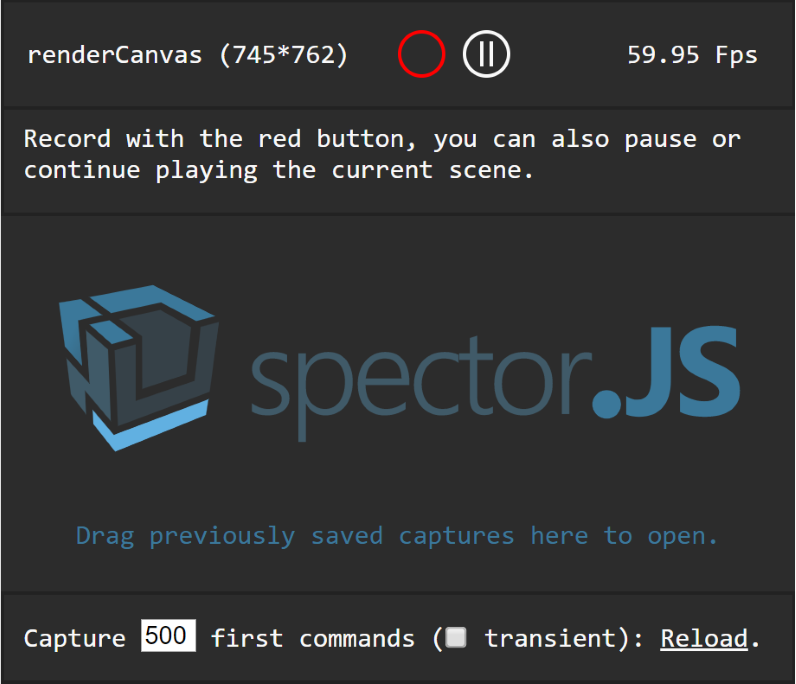
Explore and Troubleshoot your WebGL scenes (All engines and Vanilla script support) with ease.
Spector is a tool aimed at WebGL developers wanting to know what happens in their context. It enables capturing of all the available information from a frame. You will be able to look at your entire commands list with their associated visual states and context information.


This can be used either as a browser extension or directly from your page with a Standalone Version.
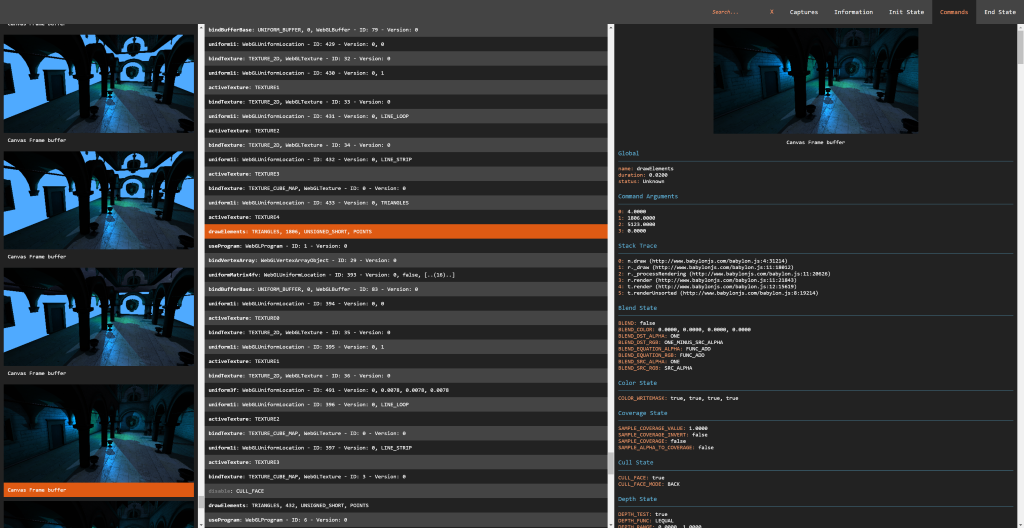
Table of Content
Why
As a core member of the BabylonJS team I often found the need to debug what was happening to my webgl context. I was a huge fan of webgl inspector until we introduced WebGl2 in Babylon. As the WebGL community as a whole is our focus, I thought it would be great to share an extension compatible with all the Webgl/Webgl2 engines available.
You can use the library inside of your own application easily as it is transpiled as a UMD module. It will either work as a script reference or with your favorite bundling tools like webpack.
Browser extension
If you are willing to use the browser extension, you can direclty install it from the store:
You can find on Real Time Rendering a complete tutorial about the Spector extension. Else, you can refer to the extension documentation to learn how to use it.
Or you can take a look at the following documentation to load it from the source: Browser Extension.
Use as a Module
In order to install the library in your application directory, please type the following command on a command line prompt open on the application directory:
npm install spectorjs
From this point you are all set to use it in your app.
Webpack sample
As a quick demo, here is a simple way to use the spector module with webpack.
Please follow the instructions below to create a new directory and install the required tools:
mkdir sample
cd sample
npm init
npm install webpack --save-dev
npm install spectorjs --save-dev
Following the HelloWorld example from Webpack, you can now create it in the sample folder:
A js file named entry.js containing the following code:
var SPECTOR = require("spectorjs");

var spector = new SPECTOR.Spector();
spector.displayUI();
And an html file named index.js containing the following code:
<html>
    <head>
    </head>
    <body>
        <script type="text/javascript" src="bundle.js" charset="utf-8"></script>
    </body>
</html>
Now your application is ready. Go back to your command line and bundle the javascript file:
webpack entry.js bundle.js
You are all set. You can open your index.html file and see the inspector running. It obviously won't be that usefull on an empty page but at least you get the integration idea.
Use as a Script Reference
CDN
Feel free to leverage the CDN to use the library from your own projets: https://spectorcdn.babylonjs.com/spector.bundle.js
Repo
If you prefer to host your own version, the library is available in the dist folder of the repo.
node_modules
If you used npm to install the library you can find the spector.bundle.js file in the node_module/spectorjs/dist folder.
How To Reference
Simply add the following tag in your html page header:
<script type="text/javascript" src="https://spectorcdn.babylonjs.com/spector.bundle.js"></script>
Basic Usage
Once available in your app, you can instantiate an inspector by inserting the following command in your script:
var spector = new SPECTOR.Spector();
You can then display the embedded UI directly in your page:
spector.displayUI();
Or launch a capture and reuse its JSON result at your will:
spector.onCapture.add((capture) => {
var myEvent = new CustomEvent("SpectorOnCaptureEvent", { detail: { captureString: JSON.stringify(capture) } });
document.dispatchEvent(myEvent);
});
var canvas = document.getElementById("renderCanvas");
spector.captureCanvas(canvas);
Another api you can rely upon is:
spector.spyCanvases();
This will enable a complete tracking of the gl calls even before capturing which enables for instance access to the texture inputs or memory consumption information.
Custom Data
You can simply add custom data to the capture by adding a special field named __SPECTOR_Metadata to your WebGLObjects.
var cubeVerticesColorBuffer = gl.createBuffer();
cubeVerticesColorBuffer.__SPECTOR_Metadata = { name: "cubeVerticesColorBuffer" };
This will enable the visibility of your custom name in your capture. This can be an invaluable asset during troubleshoot session. This can also help with referencing your materials' friendly names from your captures.
Learn About WebGL
I would advise you to check out and start with the Awesome BabylonJS the community there will be more than happy to welcome anybody willing to learn Web 3d.