Description
This is npm version of simple Chart.js React component available at: github.com/javascriptiscoolpl/react-charts. However, this version has been changed to support npm chart.js version, ES6 syntax and npm module environment.
Install
npm install react-chart-all
Usage - show
index.html
<!DOCTYPE html>
<html>
  <head>
    <meta charset="UTF-8" />
    <title>example</title>
    <style>
    .SimpleChart {
      width: 400px;
      border: 1px dashed red;
      float: left;
      margin: 5px;
    }
    </style>
  </head>
  <body>
    <div id="app"></div>
    <script src="index.js"></script>
  </body>
</html>
index.js
The default type is line, so you can skip it here.
import React from "react";
import ReactDOM from "react-dom";
import Chart from "chart.js";
import rcl from "react-chart-all";

// sample page content
class App extends React.Component {

  constructor(props) {
    super(props);
  }

  render() {
    var chart = this.props.data;
    return (
      <div>
        <rcl.SimpleChart data={chart} type={"line"}/>
        <rcl.SimpleChart data={chart} type={"bar"}/>
        <rcl.SimpleChart data={chart} type={"radar"}/>
        <rcl.SimpleChart data={chart} type={"polarArea"}/>
        <rcl.SimpleChart data={chart} type={"pie"}/>
        <rcl.SimpleChart data={chart} type={"doughnut"}/>
        <rcl.SimpleChart data={chart}/>
        <rcl.SimpleChart data={chart} type={"radar"}/>
        <rcl.SimpleChart data={chart} type={"bar"}/>
      </div>
    );
  }
}

// sample usage 1
var chart = { msg: "test chart", osX: [], osY: [] };
for (var i=0,x=0; i<5; i++,x++) {
  chart.osX[i] = "id "+x;
  chart.osY[i] = x+5;
}
ReactDOM.render(
  <App data={chart}/>,
  document.getElementById('app')
);
Usage - update
To update chart just send new props to the React component.
index.js
var chart = { msg: "testing random chart", osX: [], osY: [] };
function setRandomChart() {
  for (var i=0,x=0; i<8; i++,x++) {
    chart.osX[i] = "id "+x;
    chart.osY[i] = x*Math.random();
  }
  ReactDOM.render(
    <App data={chart}/>,
    document.getElementById('app')
  );
}
setInterval(() => { setRandomChart() }, 5000);
Demo (might be very slow)
The demo is available in module directory. To test the demo just go to demo directory in module folder and open index.html in your browser.
However, you can build the demo again with npm. To re-build the demo just go to demo directory in module folder and run command:
npm run build
This should download all packages and build the demo index.js file again. After it, you can open index.html in your browser. Should work :-)
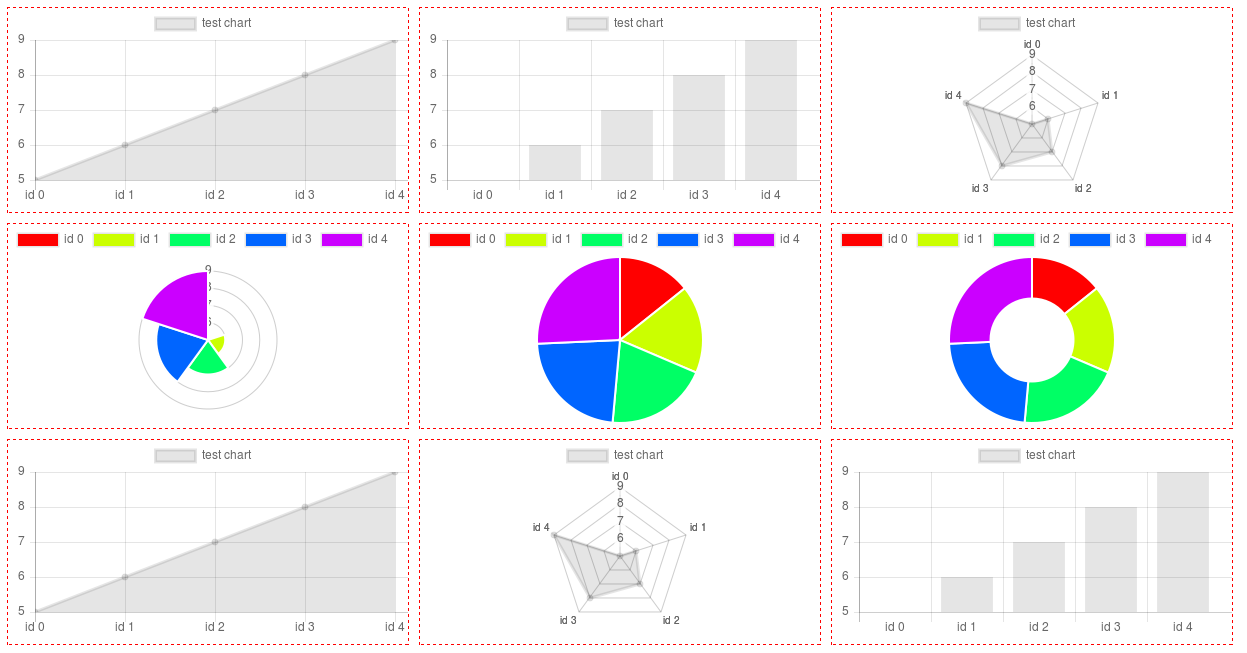
Screenshot (demo)
Additional info (Polar, Pie, Doughnut)
For this type of chart you need only osY values in fact. They must be positive to show on chart. The osX is taken as labels here (can be strings). Colors are calculated according to the osY length, more data more colors.
License
MIT


