react-grid-heatmapjs
Advanced tools

Comparing version 0.9.8 to 0.9.9
| { | ||
| "name": "react-grid-heatmapjs", | ||
| "version": "0.9.8", | ||
| "version": "0.9.9", | ||
| "description": "React for the user interface, Tailwind CSS for styling, and CSS Grid for layout. A heatmap is a data visualization technique that uses color to represent the magnitude of values within a two-dimensional grid or matrix.", | ||
@@ -11,3 +11,9 @@ "type": "module", | ||
| }, | ||
| "keywords": [], | ||
| "keywords": [ | ||
| "react-heatmap", | ||
| "react-grid-heatmap", | ||
| "react-grid-heatmap", | ||
| "react-grid-heatmapjs", | ||
| "heatmap" | ||
| ], | ||
| "author": "hex909", | ||
@@ -30,3 +36,3 @@ "license": "MIT", | ||
| "typescript": "^5.2.2", | ||
| "@babel/core": "^7.22.20", | ||
| "@babel/core": "^7.22.20", | ||
| "@babel/preset-env": "^7.22.20", | ||
@@ -44,5 +50,3 @@ "@babel/preset-react": "^7.22.15", | ||
| "types": "dist/index.d.ts", | ||
| "dependencies": { | ||
| }, | ||
| "dependencies": {}, | ||
| "peerDependencies": { | ||
@@ -49,0 +53,0 @@ "react": "^18.2.0", |
| # react-heatmapjs | ||
| React for the user interface, Tailwind CSS for styling, and CSS Grid for layout. A heatmap is a data visualization technique that uses color to represent the magnitude of values within a two-dimensional grid or matrix. | ||
| ## Properties | ||
| | Name | Type | Description | | ||
| | ------ | ------- |---------------| | ||
| | title (optional) | `string` | Title for Heatmap Heading | | ||
| | colorRange | {<br /> from: `number`,<br /> to: `number`,<br /> color: `string`,<br /> name:`string` <br />}[] | **from**: The lowest value in the range., <br/> **to**: The highest value in the range.,<br/> **color**: The color of cells that fall within the range, specified in hexadecimal format.,<br/> **name**: The name of the range, which will appear in the legend. | | ||
| | series | {<br />name: `string`,<br />data: `number[]`,<br />total?: `number[]` <br/>}[] | **name**: becomes the y-axis label <br /> **data**: values <br /> **total**: To display the total of row data on the right side of the heatmap along the Y-axis.. | | ||
| | xaxis | {<br>labels: `string[]`,<br>totals?: `number[]`<br>} | **labels**: label property becomes the label for the x-axis <br /> **totals**: To display the total of column data beneath the label. | ||
| ## Examples | ||
| ``` | ||
| const data = { | ||
| title: "Dummy Heat Map", | ||
| colorRange: [ | ||
| { | ||
| from: 0, | ||
| to: 30, | ||
| color: "#4074b3", | ||
| name: "Cold", | ||
| }, | ||
| { | ||
| from: 30, | ||
| to: 60, | ||
| color: "#ffc039", | ||
| name: "Hot", | ||
| }, | ||
| ], | ||
| series: [ | ||
| { | ||
| name: "Series 1", | ||
| data: [10, 5, 50, 2, 25], | ||
| total: 150, | ||
| }, | ||
| { | ||
| name: "Series 2", | ||
| data: [1, 12, 50, 11, 18], | ||
| total: 125, | ||
| }, | ||
| { | ||
| name: "Series 3", | ||
| data: [3, 7, 17, 50, 14], | ||
| total: 175, | ||
| }, | ||
| ], | ||
| xaxis: { | ||
| labels: ["Label 1", "Label 2", "Label 3", "Label 4", "Label 5"], | ||
| totals: [30, 60, 90, 120, 150], | ||
| }, | ||
| }; | ||
| ``` | ||
| The data above will produce this heatmap. | ||
| 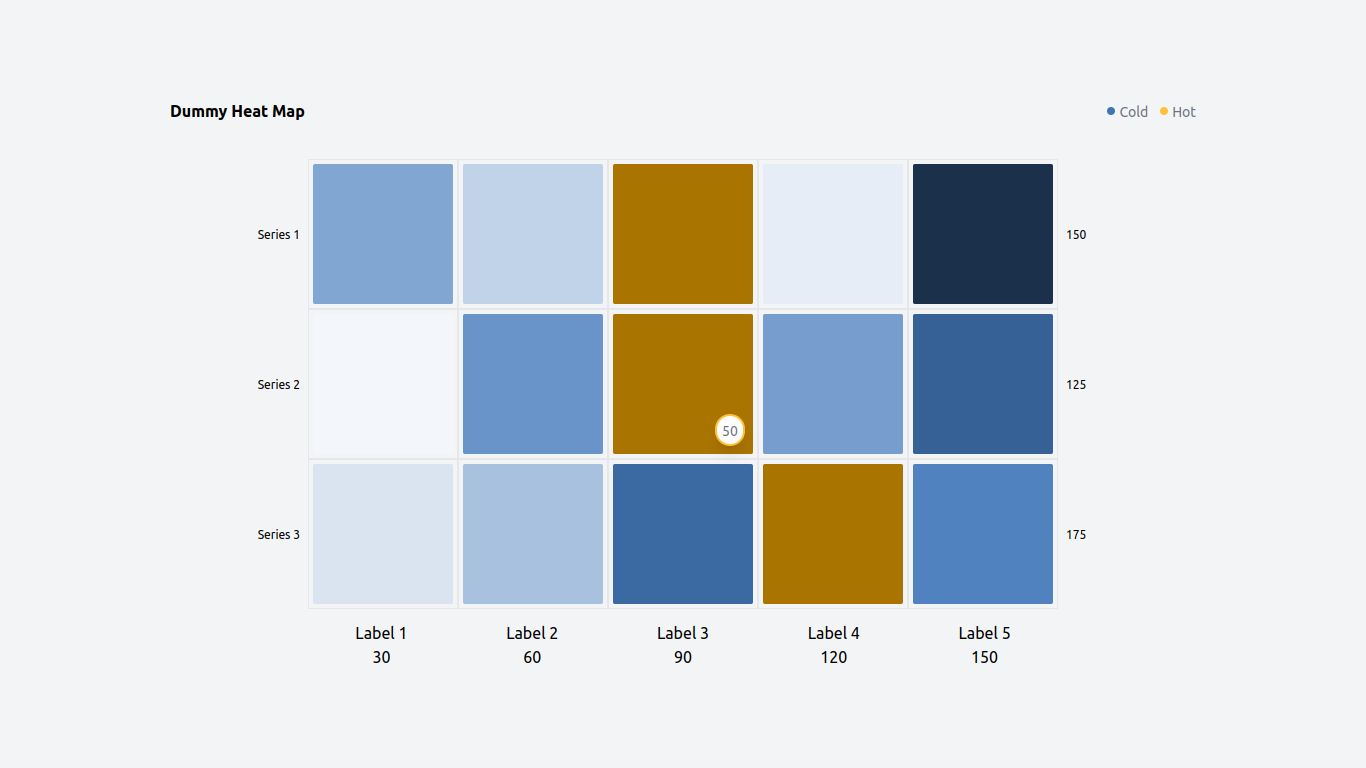 | ||
| ## For developers | ||
@@ -5,0 +59,0 @@ ### Getting the Source Code |
Fixed alerts
Major refactor
Supply chain riskPackage has recently undergone a major refactor. It may be unstable or indicate significant internal changes. Use caution when updating to versions that include significant changes.
Found 1 instance in 1 package
Improved metrics
- Total package byte prevSize
- increased by0.22%
857899
- Number of lines in readme file
- increased by154.29%
89
- Number of medium supply chain risk alerts
- decreased by-100%
0
No dependency changes