


Research
Malicious fezbox npm Package Steals Browser Passwords from Cookies via Innovative QR Code Steganographic Technique
A malicious package uses a QR code as steganography in an innovative technique.
By Olivia Brown - Sep 22, 2025
react-minimal-pie-chart
Advanced tools
![]()

![]()
Lightweight React SVG pie charts, with versatile options and CSS animation included. ~2kB gzipped. 👏 Demo 👏.

Because Recharts is awesome, but when you just need a simple pie/donought chart, 2kB are usually enough.
| Size by Bundlefobia | Benchmark Size * | Loading time on a slow 3g * | |
|---|---|---|---|
| react-minimal-pie-chart (v9.0.0) | 1.99 KB | ~40 ms | |
| rechart (v1.8.5) | 96.9 KB | ~1900 ms | |
| victory-pie (v34.1.3) | 50.5 KB | ~1100 ms | |
| react-apexcharts (v1.3.7) | 114.6 KB | ~2300 ms | |
| react-vis (v1.11.7) | 78.3 KB | ~1600 ms |
* Benchmark carried out with size-limit with a "real-world" setup: see benchmark repo. (What matter here are not absolute values but the relation between magnitudes)
npm install react-minimal-pie-chart
If you don't use a package manager, react-minimal-pie-chart exposes also an UMD module ready for the browser.
https://unpkg.com/react-minimal-pie-chart/dist/index.js
Minimum supported Typescript version: >= 3.8
import { PieChart } from 'react-minimal-pie-chart';

<PieChart
  data={[
    { title: 'One', value: 10, color: '#E38627' },
    { title: 'Two', value: 15, color: '#C13C37' },
    { title: 'Three', value: 20, color: '#6A2135' },
  ]}
/>;
| Property | Type | Description | Default |
|---|---|---|---|
| data | DataEntry[] | Source data. Each entry represents a chart segment | [] |
| lineWidth | number (%) | Line width of each segment. Percentage of chart's radius | 100 |
| startAngle | number | Start angle of first segment | 0 |
| lengthAngle | number | Total angle taken by the chart (can be negative to make the chart clockwise!) | 360 |
| totalValue | number | Total value represented by the full chart | - |
| paddingAngle | number | Angle between two segments | - |
| rounded | boolean | Round line caps of each segment | - |
| segmentsShift | numberor: (segmentIndex) => number | Translates segments radially. If number set, provide shift value relative to viewBoxSize space. If function, return a value for each segment.( radius prop might be adjusted to prevent segments from overflowing chart's boundaries) | - |
| segmentsStyle | CSSObjector: (segmentIndex) => CSSObject | Style object assigned to each segment. If function, return a value for each segment. (Warning: SVG only supports its own CSS props). | - |
| segmentsTabIndex | number | tabindex attribute assigned to segments | - |
| label | (labelRenderProps) => string | number | ReactElement | A function returning a label value or the SVG element to be rendered as label | - |
| labelPosition | number (%) | Label position from origin. Percentage of chart's radius (50 === middle point) | 50 |
| labelStyle | CSSObjector: (segmentIndex) => CSSObject | Style object assigned to each label. If function set, return style for each label. (Warning: SVG only supports its own CSS props). | - |
| animate | boolean | Animate segments on component mount | - |
| animationDuration | number | Animation duration in ms | 500 |
| animationEasing | string | A CSS easing function | ease-out |
| reveal | number (%) | Turn on CSS animation and reveal just a percentage of each segment | - |
| background | string | Segments' background color | - |
| children | ReactElement (svg) | Elements rendered as children of SVG element (eg. SVG defs and gradient elements) | - |
| radius | number (user units) | Radius of the pie (relative to viewBoxSize space) | 50 |
| center | [number, number] | x and y coordinates of center (relative to viewBoxSize space) | [50, 50] |
| viewBoxSize | [number, number] | width and height of SVG viewBox attribute | [100, 100] |
| onBlur | (e, segmentIndex) => void | onBlur event handler for each segment | - |
| onClick | (e, segmentIndex) => void | onClick event handler for each segment | - |
| onFocus | (e, segmentIndex) => void | onFocus event handler for each segment | - |
| onKeyDown | (e, segmentIndex) => void | onKeyDown event handler for each segment | - |
| onMouseOut | (e, segmentIndex) => void | onMouseOut event handler for each segment | - |
| onMouseOver | (e, segmentIndex) => void | onMouseOver event handler for each segment | - |
.oOo.oOo.oOo.oOo.oOo.oOo.oOo. |
Prop types are exposed for convenience:
import type { PieChartProps } from 'react-minimal-pie-chart';
data propdata prop expects an array of chart entries as follows:
type Data = {
  color: string;
  value: number;
  key?: string | number;
  title?: string | number;
  [key: string]: any;
}[];
Each entry accepts any custom property plus the following optional ones:
key: custom value to be used as segments element keys
title: title element rendered as segment's child
label render proplabel prop accepts a function returning the string, number or element rendered as label for each segment:
<PieChart
  label={(labelRenderProps: LabelRenderProps) =>
    number | string | React.ReactElement | undefined | null
  }
/>
The function receives labelRenderProps object as single argument:
type LabelRenderProps = {
  x: number;
  y: number;
  dx: number;
  dy: number;
  textAnchor: string;
  dataEntry: {
    ...props.data[dataIndex]
    // props.data entry relative to the label extended with:
    startAngle: number;
    degrees: number;
    percentage: number;
  };
  dataIndex: number;
  style: React.CSSProperties;
};
Render entries' values as labels:
label={({ dataEntry }) => dataEntry.value}
Render segment's percentage as labels:
label={({ dataEntry }) => `${Math.round(dataEntry.percentage)} %`}
See examples in the demo source.
See demo and relative source here and here.
See demo and relative source.
Here is an updated browsers support list 🔍.
The main requirement of this library is an accurate rendering of SVG Stroke properties.
Please consider that Math.sign and Object.assign polyfills are required to support legacy browsers.
This library uses the stroke-dasharray + stroke-dashoffset animation strategy described here.
transform to mutate segments/labels positionssvg element with any extra propThanks to you all (emoji key):
9.1.1
FAQs
Lightweight but versatile SVG pie/donut charts for React
The npm package react-minimal-pie-chart receives a total of 71,868 weekly downloads. As such, react-minimal-pie-chart popularity was classified as popular.
We found that react-minimal-pie-chart demonstrated a healthy version release cadence and project activity because the last version was released less than a year ago. It has 1 open source maintainer collaborating on the project.
Did you know?

Socket for GitHub automatically highlights issues in each pull request and monitors the health of all your open source dependencies. Discover the contents of your packages and block harmful activity before you install or update your dependencies.
Research
A malicious package uses a QR code as steganography in an innovative technique.

Research
/Security News
Socket identified 80 fake candidates targeting engineering roles, including suspected North Korean operators, exposing the new reality of hiring as a security function.
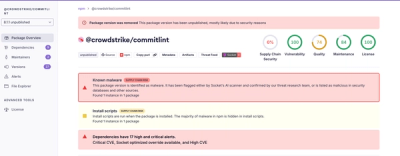
Application Security
/Research
/Security News
Socket detected multiple compromised CrowdStrike npm packages, continuing the "Shai-Hulud" supply chain attack that has now impacted nearly 500 packages.