Product
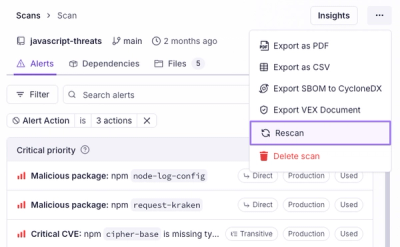
Introducing Immutable Scans
Scan results now load faster and remain consistent over time, with stable URLs and on-demand rescans for fresh security data.
By Nolan Lawson - Jan 23, 2026
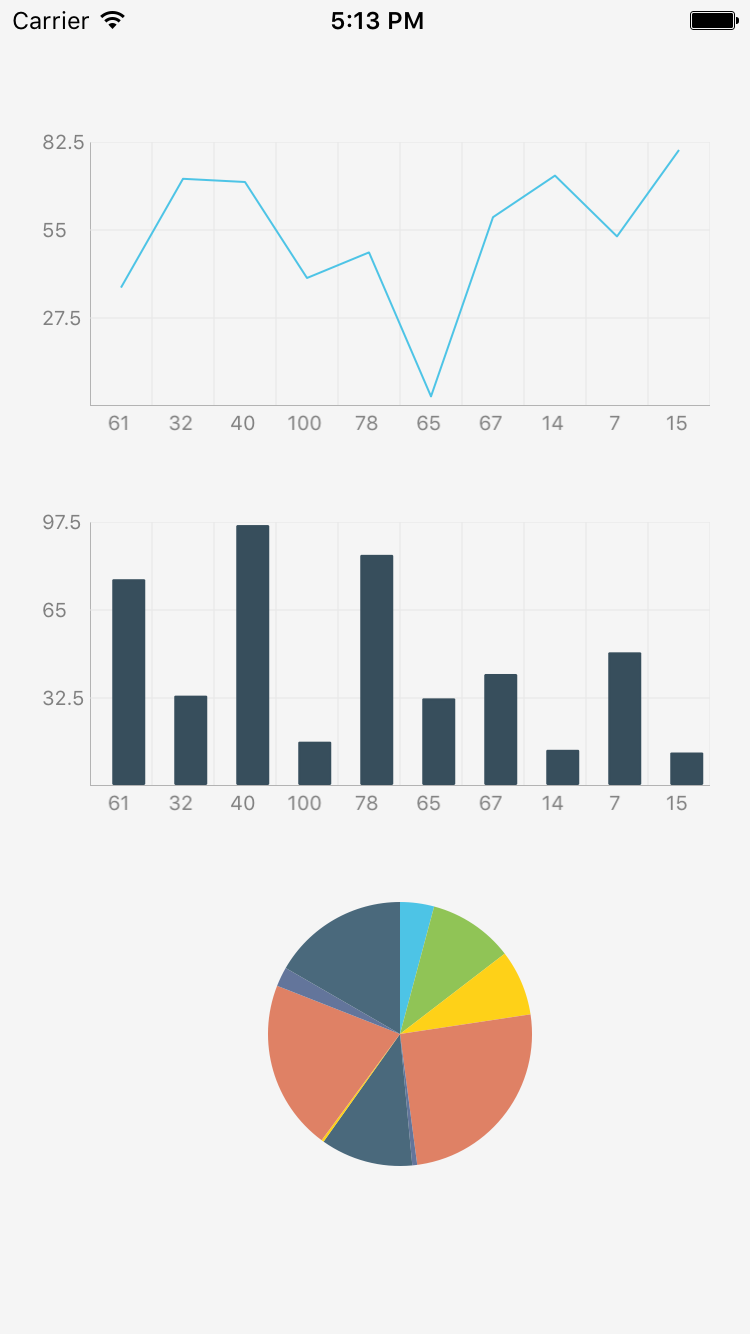
react-native-chart
Advanced tools
[](https://gitter.im/tomauty/react-native-chart) [](https://badge.fury.

![]()
react-native-chart is a simple module for adding line charts, area charts, or bar charts to your React Native app.
npm install react-native-chart --save
I recommend using rnpm for linking.
2a. npm install -g rnpm
2b. rnpm link
If you'd rather not use rnpm, you can link the library as described here.
import React, { StyleSheet, View, Component } from 'react-native';
import RNChart from 'react-native-chart';

const styles = StyleSheet.create({
	container: {
		flex: 1,
		justifyContent: 'center',
		alignItems: 'center',
		backgroundColor: 'white',
	},
	chart: {
		position: 'absolute',
		top: 16,
		left: 4,
		bottom: 4,
		right: 16,
	}
});

const chartData = [
	{
		name: 'BarChart',
		type: 'bar',
		color:'purple',
		widthPercent: 0.6,
		data: [30, 1, 1, 2, 3, 5, 21, 13, 21, 34, 55, 30],
	},
	{
		name: 'LineChart',
		color: 'gray',
		lineWidth: 2,
		highlightIndices: [1, 2],	// The data points at indexes 1 and 2 will be orange
		highlightColor: 'orange',
		showDataPoint: true,
		data: [10, 12, 14, 25, 31, 52, 41, 31, 52, 66, 22, 11],
	}
];

const xLabels = ['0','1','2','3','4','5','6','7','8','9','10','11'];

class SimpleChart extends Component {
	render() {
		return (
			<View style={styles.container}>
				<RNChart style={styles.chart}
					chartData={chartData}
					verticalGridStep={5}
					xLabels={xLabels}
				 />
			</View>
		);
	}
}
All properties are optional otherwise noted
chartData (ObjectArray) - : one nested block produces one type of chart
data - (NumberArray) - Y axis values / Requiredname - (String) - name of the plottype - (String) - "line" or "bar" / Default: line"fillColor - (String/Color) - Line chart only: area fill color / If not specified, the line will not be filledlineWidth - (Float) - Line chart only: line width / Default: 1.0widthPercent - (Float) - Bar chart only: [0 - 1.0], 0.1 means very skinny, 1.0 means bars touch each other / Default: 0.5showDataPoint - (Boolean) - show or hide the data points / Default: falsedataPointColor - (String/Color) - outline color of the data point / Default: bluedataPointFillColor - (String/Color) - fill color of the data point / Default: bluedataPointRadius - (Float) - the radius of the data point / Default: 1.0cornerRadius - (Float) corner radius of the bars in a bar chart / Default: 1.0 / If 0, it will be completely rectangular.highlightColor - (String/Color) - the color of the highlighted data points at the highlight indices. this will override dataPointColor and dataPointFillColor.highlightIndices - (NumberArray) - the indices to apply the highlightColorhighlightRadius - (Float) - the radius of a highlighted data point / Default: 1.0sliceColors (Array) - array of colors for the pie chart slices. matched by index with the chartData.data array. if fewer specified, remaining slices will be blue for now. Required for pie chartanimationDuration (Float) - duration of the animation in seconds / Default: 0.3
axisColor (String/Color) - color of the X and Y axes / Default: lightgray
axisLineWidth (Float) - width of the axis line / Default: 1
axisTitleColor (String/Color) - color of the title of the axes / Default: gray
axisTitleFontSize (Integer) - font size of axis titles / Default: 10
chartTitle (String) - title of the chart
chartTitleColor (String/Color) - color of the chart title / Default: gray
gridColor (String/Color) - color of the grid / Default: lightgray
gridLineWidth (Float) - width of the grid line / Default: 0.5
hideHorizontalGridLines (Boolean) - hides the horizontal grid lines when showGrid is true / Default: false
hideVerticalGridLines (Boolean) - hides the vertical grid lines when showGrid is true / Default: false
labelFontSize (Integer) - font size of axis labels / Default: 10
labelTextColor (String/Color) - text color of axis labels / Default: gray
showAxis (Boolean) - show or hide axis / Default: true
showGrid (Boolean) - show or hide grid / Default: true
showXAxisLabels (Boolean) - show or hide axis labels for the X axis / Default: true
showYAxisLabels (Boolean) - show or hide axis labels for the Y axis / Default: true
tightBounds (Boolean) - constrict Y axis to min/max of values instead of max/minning with 0 / Default: false
verticalGridStep (Integer) - number of Y axis grids / Default: 3
xAxisTitle (String) - Title for the x-axis
xLabels (StringArray) - array of all X axis label strings. This determines the X-axis grid as well. Need to match the number of input data in chartData / Required
yAxisTitle (String) - Title for the y-axis
Work prior to repo transfer on Feb 1, 2015 was the work of Hyun Cho @ OneFold.
Email tom.auty@gmail.com for support.
FAQs
[](https://gitter.im/tomauty/react-native-chart) [](https://badge.fury.
The npm package react-native-chart receives a total of 42 weekly downloads. As such, react-native-chart popularity was classified as not popular.
We found that react-native-chart demonstrated a not healthy version release cadence and project activity because the last version was released a year ago. It has 2 open source maintainers collaborating on the project.
Did you know?

Socket for GitHub automatically highlights issues in each pull request and monitors the health of all your open source dependencies. Discover the contents of your packages and block harmful activity before you install or update your dependencies.
Product
Scan results now load faster and remain consistent over time, with stable URLs and on-demand rescans for fresh security data.
Product
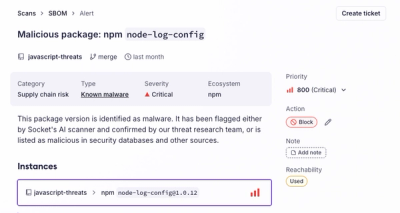
Socket's new Alert Details page is designed to surface more context, with a clearer layout, reachability dependency chains, and structured review.
Product
Campaign-level threat intelligence in Socket now shows when active supply chain attacks affect your repositories and packages.