react-native-echarts-pro


English 简体中文
Better charting tools based on native-echarts.
Summary
Core:
1. Solve the problem of android tpl.html file reference;
2. echarts version upgraded to 5.0;
3. Support all kinds of original charts, new support map chart;
4. Continuous optimization...
Getting started
$ npm install react-native-echarts-pro --save
Rely
$ npm install react-native-webview --save
Usage
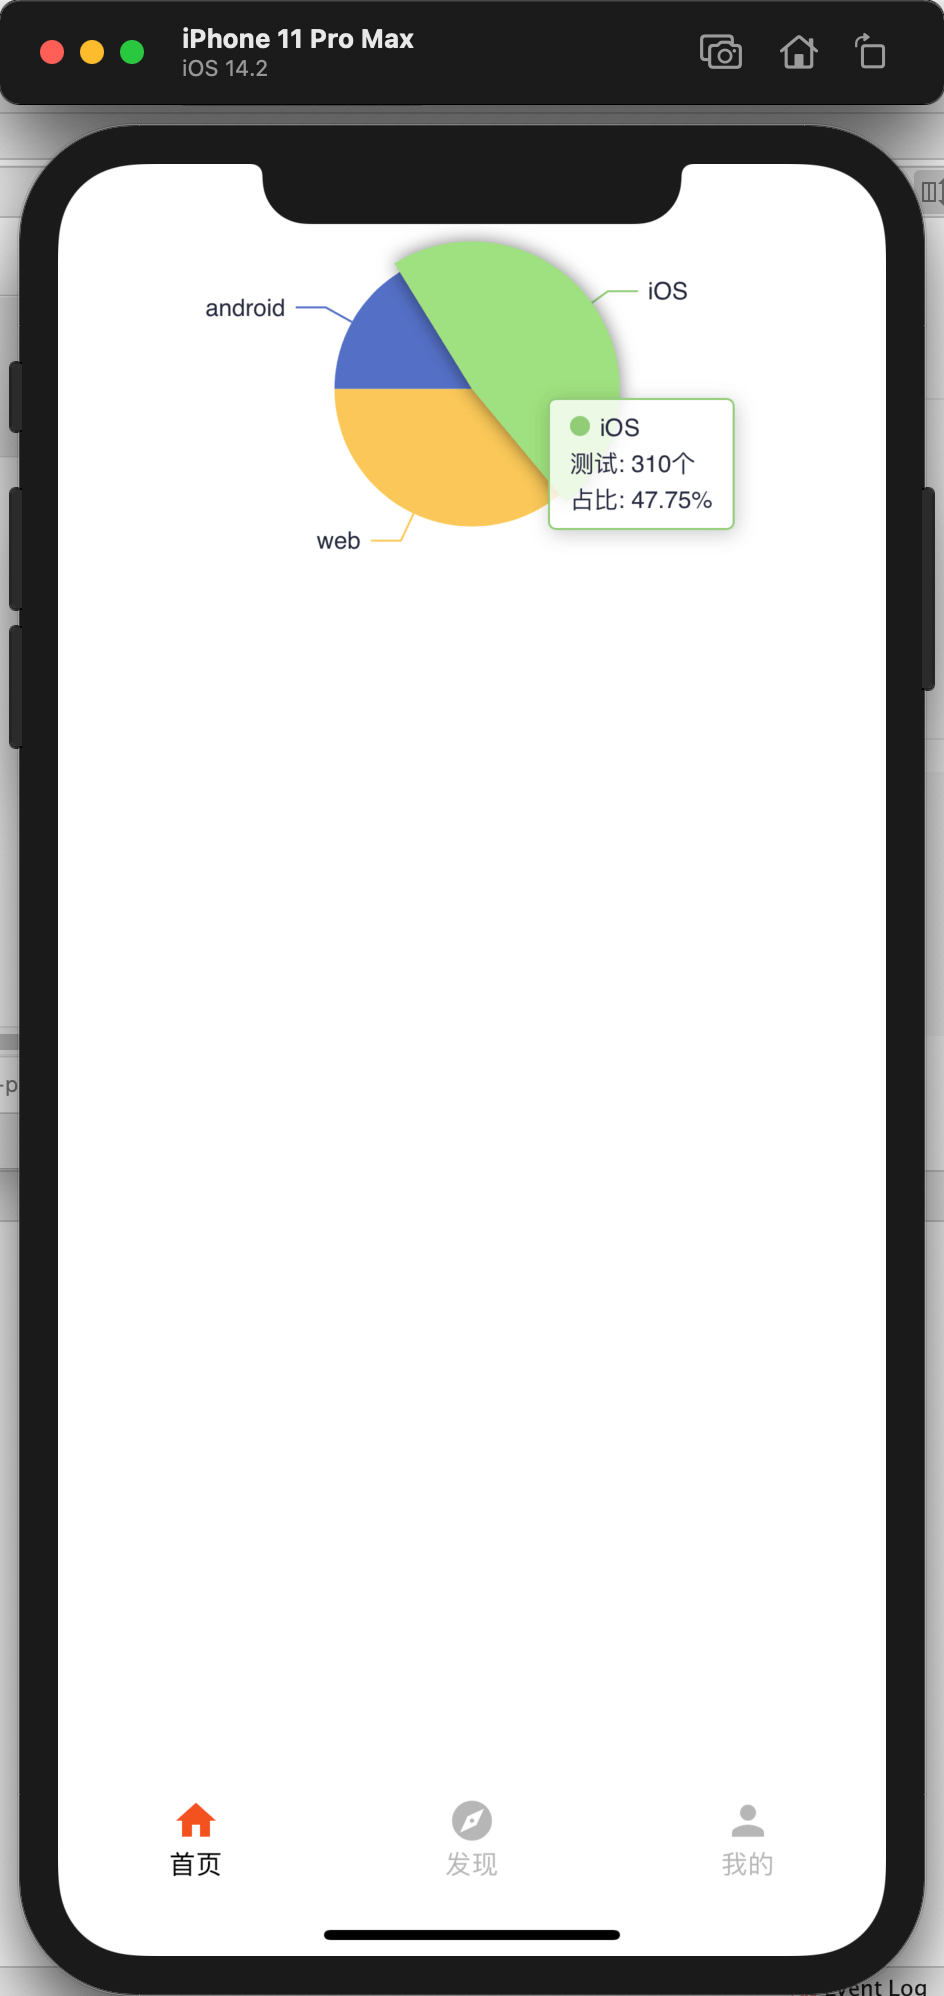
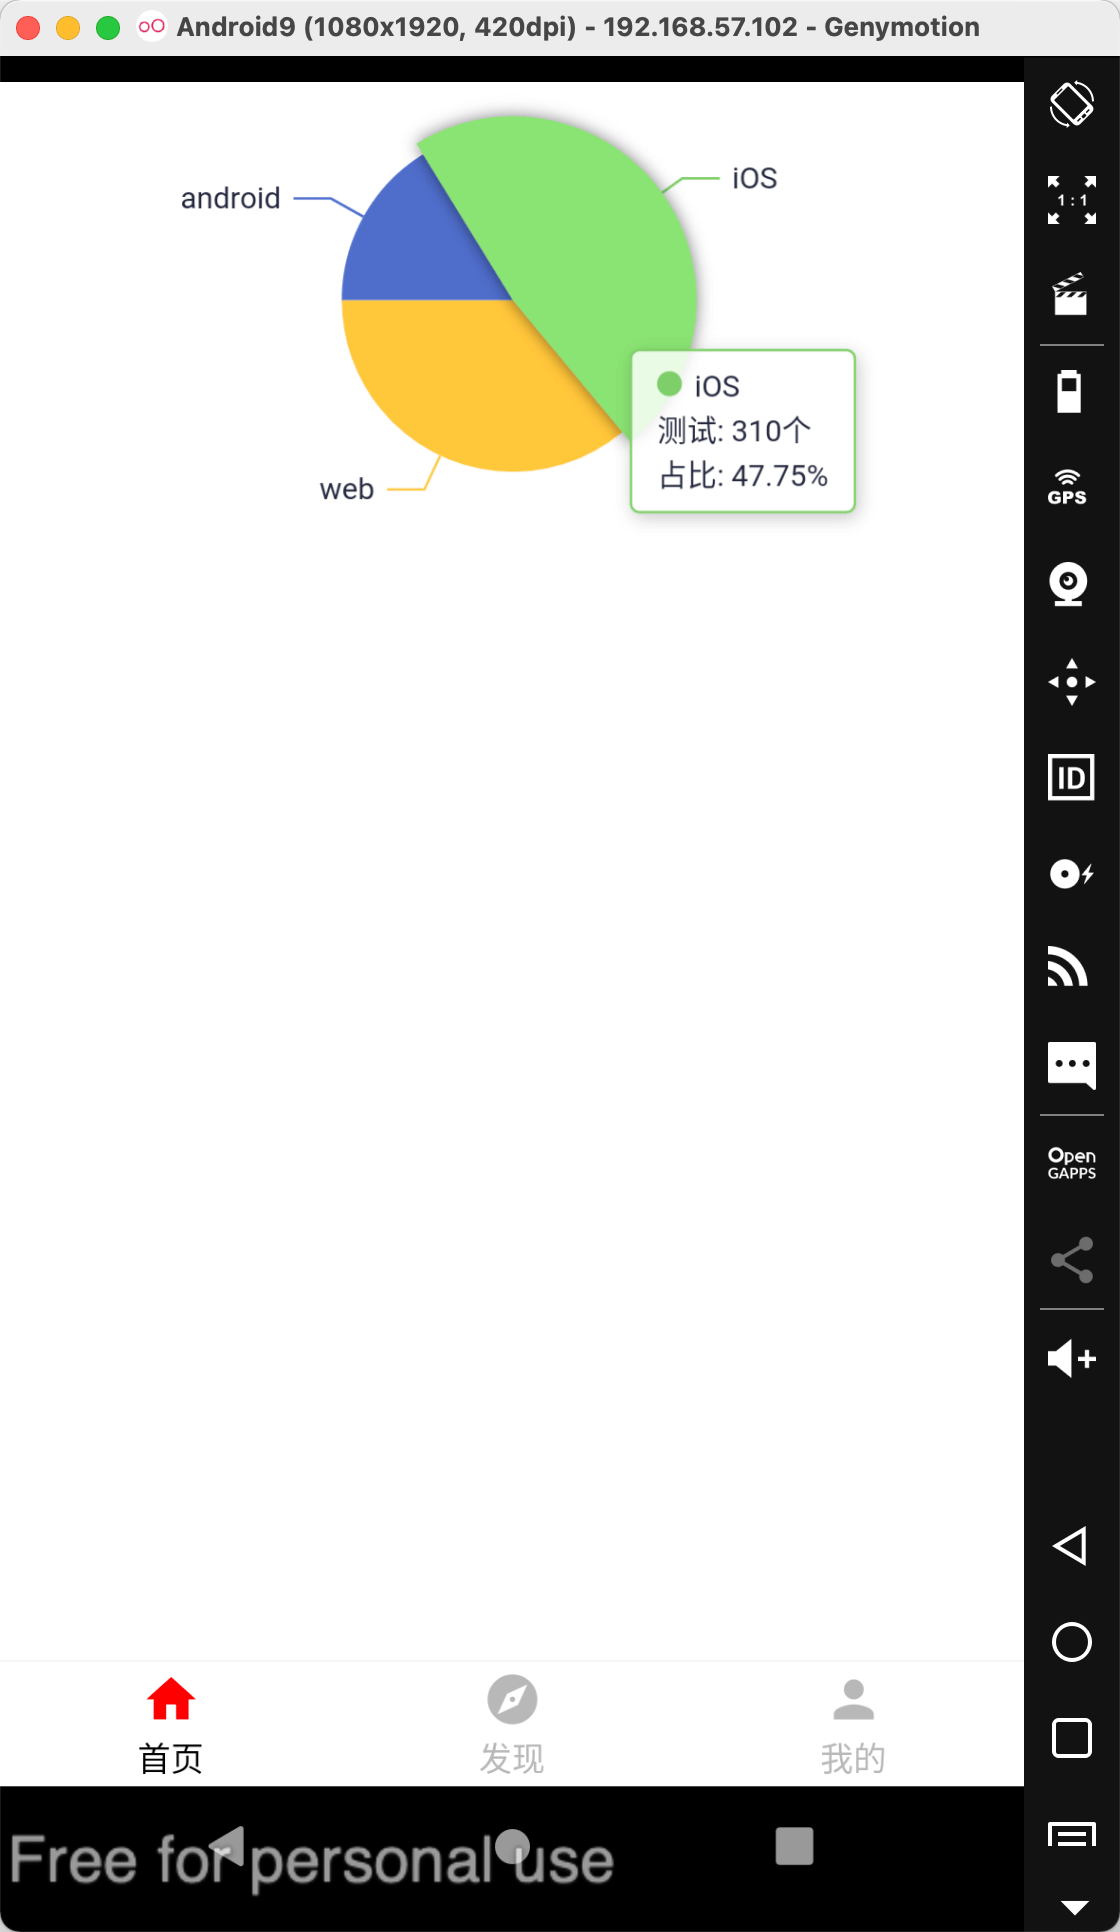
1.Base Usage
import React, { Component } from 'react';
import { View } from 'react-native';
import RNEChartsPro from 'react-native-echarts-pro';
export default class Demo extends Component {
constructor(props) {
super(props);
this.pieOption = {
color: this.colors,
tooltip: {
backgroundColor: 'rgba(255,255,255,0.8)',
borderColor: '#668BEE',
borderWidth: 1,
padding: [5, 10],
textStyle: {
color: '#24283C',
fontSize: 12
},
trigger: 'item',
formatter: function(a) {
return (
'<i style="display: inline-block;width: 10px;height: 10px;background: ' +
a['color'] +
';margin-right: 5px;border-radius: 50%;}"></i>' +
a['name'] +
'</br>测试: ' +
a['value'] +
'个 ' +
'<br>占比: ' +
a['percent'] +
'%'
);
}
},
series: [
{
name: '广告访问来源',
type: 'pie',
legendHoverLink: true,
hoverAnimation: true,
avoidLabelOverlap: true,
startAngle: 180,
radius: '55%',
center: ['50%', '35%'],
data: [{ value: 105.2, name: 'android' }, { value: 310, name: 'iOS' }, { value: 234, name: 'web' }],
label: {
normal: {
show: true,
textStyle: {
fontSize: 12,
color: '#23273C'
}
}
},
emphasis: {
lable: {
show: true,
fontSize: 12,
color: '#668BEE'
},
itemStyle: {
show: true,
shadowBlur: 10,
shadowOffsetX: 0,
shadowColor: 'rgba(0, 0, 0, 0.5)'
}
}
}
]
};
}
render() {
return (
<View style={{ height: 300, paddingTop: 25 }}>
<RNEChartsPro height={250} option={this.pieOption} />
</View>
);
}
}
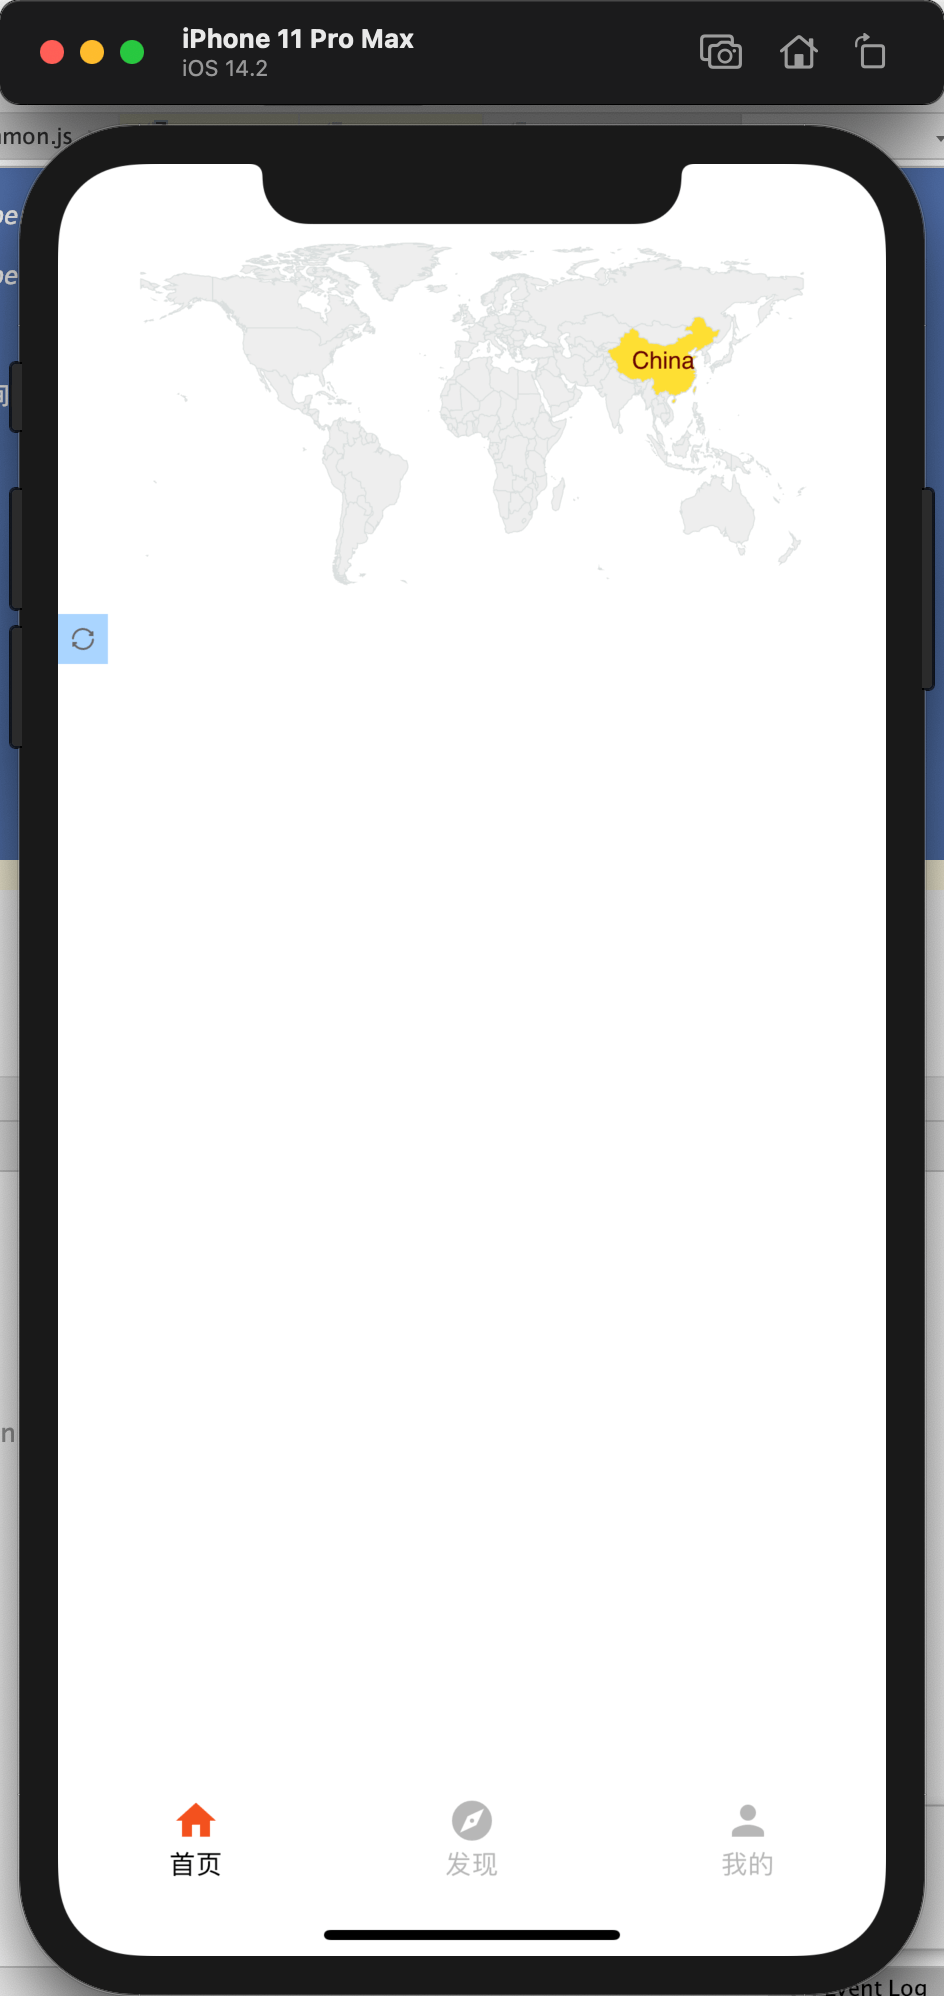
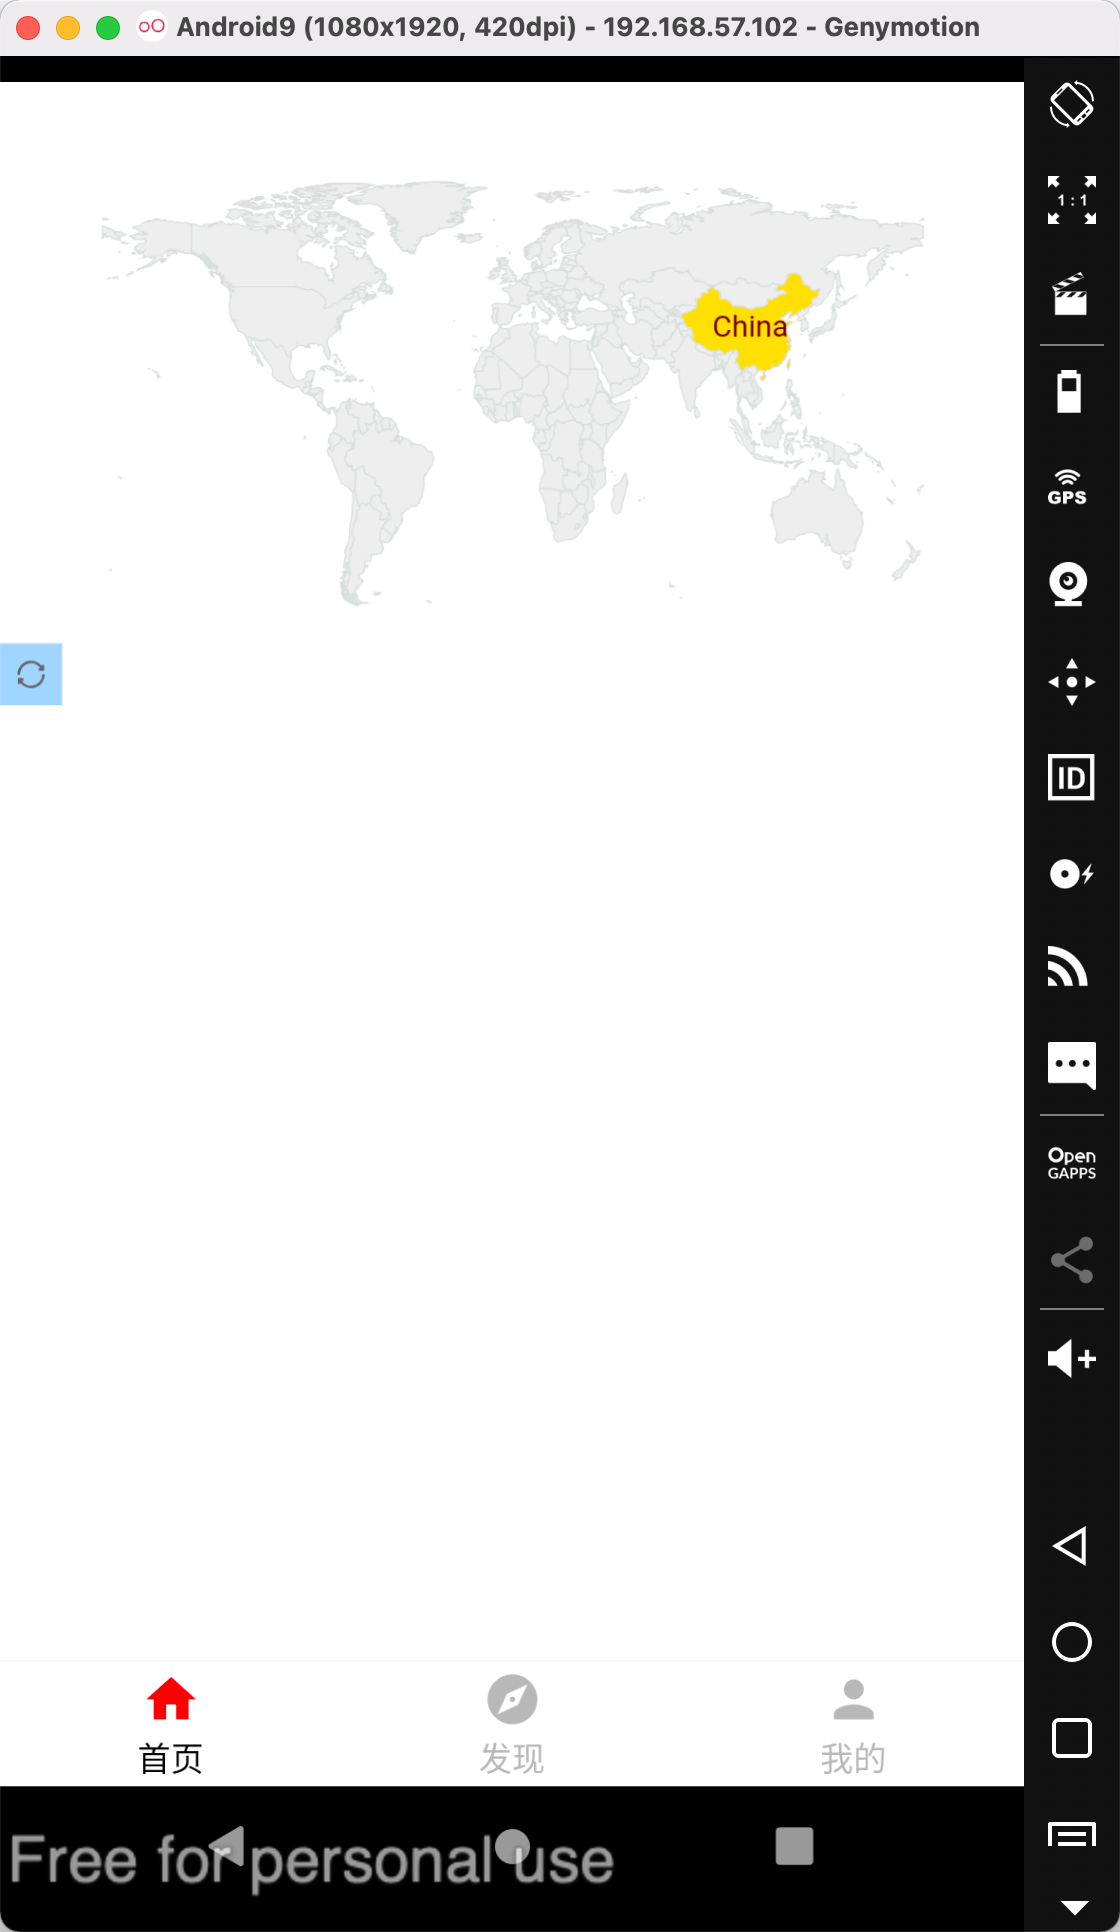
2.Map Usage
import React, { Component } from 'react';
import { View } from 'react-native';
import RNEChartsPro from 'react-native-echarts-pro';
export default class Demo extends Component {
constructor(props) {
super(props);
this.mapData = {
visualMap: {
show: false,
left: 'right',
top: 'center',
min: 1,
max: 3,
calculable: true
},
series: [
{
type: 'map',
map: 'world',
mapType: 'world',
selectedMode: 'single',
itemStyle: {
normal: {
areaStyle: { color: '#B1D0EC' },
color: '#B1D0EC',
borderColor: '#dadfde'
},
emphasis: {
label: {
show: true,
textStyle: {
color: '#000000'
}
}
}
},
data: [],
roam: true
}
],
toolbox: {
show: true,
orient: 'horizontal',
x: 'left',
y: 'bottom',
backgroundColor: '#1e90ff60',
itemGap: 10,
itemSize: 10,
color: '#ffffff',
showTitle: false,
feature: {
restore: {
show: true,
title: '还原'
}
}
}
};
}
render() {
return (
<View style={{ height: 300 }}>
<RNEChartsPro height={250} option={this.mapData} />
</View>
);
}
}
Props
| height | number | 400 | Chart area height |
| option | object | null | Chart data configuration items, see details:https://echarts.apache.org/zh/option.html#title |
| backgroundColor | string | transparent | Chart background color |
| themeName | string | - | There are only six officially available themes:
vintage || dark || macarons || infographic || shine || roma |
Method
| setNewOption | option | Reassign and render the chart. |
| onPress | callbackData | Chart click event,callbackData is the clicked data. |
| onDataZoom | callbackData | Chart zoom event. |
TODO LIST
- Custom map data;
- Custom theme;