react-native-svg-charts
Advanced tools

Comparing version 4.2.0 to 5.0.0-RC
| * **Support for horizontal StackedBarChart** | ||
| Version 5.0 is a major overhaul to the "decorator" and "extras" pattern. | ||
| We've simplified the API, made it declarative and added support for | ||
| rendering order. | ||
| StackedBarChart now supports the prop `horizontal` | ||
| just as a regular BarChart | ||
| All charts and axes now support React children. Meaning that your decorators | ||
| and extras should now be placed as direct children to the chart in question. | ||
| This is a breaking change but a very easy one to migrate (I migrated all storybooks in a matter of minutes), | ||
| see the [examples repo](https://github.com/JesperLekland/react-native-svg-charts-examples) | ||
| and read the [docs](https://github.com/JesperLekland/react-native-svg-charts#react-native-svg-charts) for inspiration. | ||
| I want to thank everyone who is contributing by submitting issues and joining | ||
| in on discussions. A special thanks to @narciero, @Sprit3Dan and @RoarRain for | ||
| contributing with PRs. | ||
| * **StackedBar/AreaChart adheres to new `extras` api** | ||
| ## Breaking Changes | ||
| * **Extras and Decorators have been removed** | ||
| StackedBarChart and StackedAreaChart was still on the legacy `renderExtras` | ||
| pattern. It has now been migrated to the single `extras` prop api. | ||
| Extras and decorators should now be passed in as children to the chart in question. | ||
| Each child will be called with similar arguments as before. See | ||
| [README](https://github.com/JesperLekland/react-native-svg-charts#react-native-svg-charts) | ||
| for more info. | ||
| Migrating an extra is as simple as just moving it from the `extras` array to a child of the chart. | ||
| The `decorators` are nearly as easy to migrate. Create a wrapper component around | ||
| your decorator that accepts the `data` prop, now you yourself can map this array and return as many decorators as you want. | ||
| * **renderGrid and gridProps have been removed** | ||
| A grid show now be rendered through as a child. We still expose a default `Grid` | ||
| component as part of the API but this must no manually be added to all charts that want to display a grid. | ||
| As a result of this the following props are deprecated: | ||
| * `showGrid` | ||
| * `gridProps` | ||
| * `renderGrid` | ||
| * **Grids are consolidate into one** | ||
| Before we hade `Grid.Vertical`,`Grid.Horizontal` and `Grid.Both`, | ||
| now we simply have `Grid` with a `direction` property. See [README](https://github.com/JesperLekland/react-native-svg-charts#react-native-svg-charts) | ||
| for more info | ||
| { | ||
| "name": "react-native-svg-charts", | ||
| "version": "4.2.0", | ||
| "version": "5.0.0-RC", | ||
| "private": false, | ||
@@ -5,0 +5,0 @@ "description": "Customizable charts (Line, Bar, Area, Pie, Circle, Progress) for React Native", |
251
README.md
@@ -10,5 +10,4 @@ # react-native-svg-charts | ||
| ### version 4 now available! | ||
| BarChart and PieChart have joined the latest API! | ||
| A few of breaking changes are introduced in this version but we've taken great care to make sure migrating is easy. | ||
| ### version 5 is now available! | ||
| A much improved decorator system has been introduced, allowing for greater flexibility and less complexity. | ||
| See [releases](https://github.com/JesperLekland/react-native-svg-charts/releases) for more information. | ||
@@ -37,6 +36,7 @@ | ||
| We built this library to be as extensible as possible while still providing you with the most common charts and data visualization tools out of the box. | ||
| The Line-, Bar-, Area- and Pie- charts can all be extended with "decorators" and "extras". | ||
| The `renderDecorator` prop is called on each passed `data` entry and allows you to easily add things such as points or other decorators to your charts. | ||
| The `extras` prop is used to further decorate your charts with e.g intersections, projections, gradients and much more, see the [examples repo](https://github.com/JesperLekland/react-native-svg-charts-examples) for more info. | ||
| We're very proud of our "decorator" support. All charts can be extended with "decorators", a component that somehow styles or enhances your chart. | ||
| Simply pass in a `react-native-svg` compliant component as a child to the graph and it will be called with all the necessary information to layout your decorator. | ||
| See each chart for information on what data the decorator will be called with. | ||
| Feedback and PR's are more than welcome 🙂 | ||
@@ -80,3 +80,3 @@ | ||
| | svg | `{}` | an object containing all the props that should be passed down to the underlying `react-native-svg` component. [See available props](https://github.com/react-native-community/react-native-svg#common-props)| | ||
| | animate | true | PropTypes.bool | | ||
| | animate | false | PropTypes.bool | | ||
| | animationDuration | 300 | PropTypes.number | | ||
@@ -90,6 +90,16 @@ | style | undefined | Supports all [ViewStyleProps](https://facebook.github.io/react-native/docs/viewstyleproptypes.html) | | ||
| | gridMax | undefined | The same as "gridMin" but will instead increase the grids maximum value | | ||
| | renderGrid | `Grid.Horizontal` | A function that returns the component to be rendered as the grid | | ||
| | extras | undefined | An array of whatever data you want to render. Each item in the array will call `renderExtra`. [See example](#extras) | | ||
| | renderDecorator | `() => {}`| Called once for each entry in `dataPoints` and expects a component. Use this prop to render e.g points (circles) on each data point. [See example](#decorator) | | ||
| | children | undefined | One or many `react-native-svg` components that will be used to enhance your chart| | ||
| ## Common arguments to children | ||
| | Property | Description | | ||
| | --- | --- | | ||
| | x | a function that normally accepts the index of a data point an returns its 'x' location on the canvas | | ||
| | y | a function that normally accepts the value of a data point an returns its 'y' location on the canvas | | ||
| | width | the width of the canvas in pixels | | ||
| | height | the height of the canvas in pixels | | ||
| | data | the same data array provided to the chart, use this to map over your data points if you want decorators on each point | | ||
| | ticks | if `numberOfTicks` has been provided to the chart this array will include the calculated tick values (useful for grids) | | ||
| ## Components | ||
@@ -108,6 +118,7 @@ | ||
| Also see [other examples](#other-examples) | ||
| * [Decorator](#decorator) | ||
| * [Extras](#extras) | ||
| Also see | ||
| * [Children](#children) | ||
| * [Grid](#grid) | ||
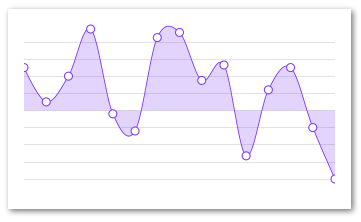
| ### AreaChart | ||
@@ -121,3 +132,3 @@ | ||
| import React from 'react' | ||
| import { AreaChart } from 'react-native-svg-charts' | ||
| import { AreaChart, Grid } from 'react-native-svg-charts' | ||
| import * as shape from 'd3-shape' | ||
@@ -133,8 +144,10 @@ | ||
| <AreaChart | ||
| style={ { height: 200 } } | ||
| style={{ height: 200 }} | ||
| data={ data } | ||
| contentInset={ { top: 30, bottom: 30 } } | ||
| curve={shape.curveNatural} | ||
| contentInset={{ top: 30, bottom: 30 }} | ||
| curve={ shape.curveNatural } | ||
| svg={{ fill: 'rgba(134, 65, 244, 0.8)' }} | ||
| /> | ||
| > | ||
| <Grid/> | ||
| </AreaChart> | ||
| ) | ||
@@ -153,2 +166,6 @@ } | ||
| #### Arguments to children | ||
| Supports all [Common arguments to children](#common-arguments-to-children) | ||
| ### StackedAreaChart | ||
@@ -234,2 +251,17 @@ | ||
| #### Arguments to children | ||
| | Property | Description | ||
| | --- | --- | | ||
| | x | a function that normally accepts the index of a data points an returns its 'x' location on the canvas | | ||
| | y | a function that normally accepts the value of a data points an returns its 'y' location on the canvas | | ||
| | width | the width of the canvas in pixels | | ||
| | height | the height of the canvas in pixels | | ||
| | ~~data~~ | ~~the same data array provided to the chart, use this to map over your data points if you want decorators on each point~ | | ||
| | ticks | if `numberOfTicks` has been provided to the chart this array will include the calculated tick values (useful for grids) | | ||
| This chart does not call a child with the `data` argument. This is due to the fact that a lot of calculations go into | ||
| creating the stacked chart, meaning that the original `data` prop doesn't provide especially valuable information | ||
| when trying to layout decorators. It does however call with the rest of the [common arguments](#common-arguments-to-children) | ||
| ### BarChart | ||
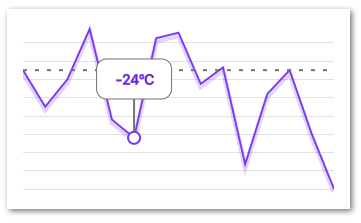
@@ -241,3 +273,3 @@ 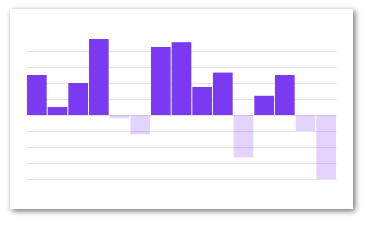 | ||
| import React from 'react' | ||
| import { BarChart } from 'react-native-svg-charts' | ||
| import { BarChart, Grid } from 'react-native-svg-charts' | ||
@@ -249,12 +281,13 @@ class BarChartExample extends React.PureComponent { | ||
| const fill = 'rgb(134, 65, 244)' | ||
| const data = [ 50, 10, 40, 95, -4, -24, 85, 91, 35, 53, -53, 24, 50, -20, -80 ] | ||
| const data = [ 50, 10, 40, 95, -4, -24, null, 85, undefined, 0, 35, 53, -53, 24, 50, -20, -80 ] | ||
| return ( | ||
| <BarChart | ||
| style={ { height: 200 } } | ||
| data={data} | ||
| style={{ height: 200 }} | ||
| data={ data } | ||
| svg={{ fill }} | ||
| contentInset={ { top: 30, bottom: 30 } } | ||
| { ...this.props } | ||
| /> | ||
| contentInset={{ top: 30, bottom: 30 }} | ||
| > | ||
| <Grid/> | ||
| </BarChart> | ||
| ) | ||
@@ -278,2 +311,10 @@ } | ||
| #### Arguments to children | ||
| | Property | Description | ||
| | --- | --- | | ||
| | bandwidth | the width of a band (a.k.a bar) | | ||
| Also supports all [Common arguments to children](#common-arguments-to-children) | ||
| ### StackedBarChart | ||
@@ -359,6 +400,19 @@ | ||
| *Note:* `renderDecorator` is not supported for this chart type. | ||
| Also see [Common Props](#common-props) | ||
| #### Arguments to children | ||
| | Property | Description | | ||
| | --- | --- | | ||
| | x | a function that normally accepts the index of a data points an returns its 'x' location on the canvas | | ||
| | y | a function that normally accepts the value of a data points an returns its 'y' location on the canvas | | ||
| | width | the width of the canvas in pixels | | ||
| | height | the height of the canvas in pixels | | ||
| | ~~data~~ | ~~the same data array provided to the chart, use this to map over your data points if you want decorators on each point~~ | | ||
| | ticks | if `numberOfTicks` has been provided to the chart this array will include the calculated tick values (useful for grids) | | ||
| This chart does not call a child with the `data` argument. This is due to the fact that a lot of calculations go into | ||
| creating the stacked chart, meaning that the original `data` prop doesn't provide especially valuable information | ||
| when trying to layout decorators. It does however call with the rest of the [common arguments](#common-arguments-to-children) | ||
| ### LineChart | ||
@@ -371,3 +425,3 @@ 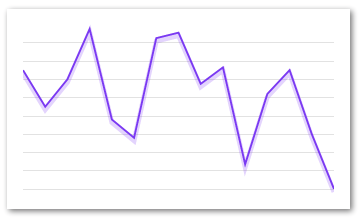 | ||
| import React from 'react' | ||
| import { LineChart } from 'react-native-svg-charts' | ||
| import { LineChart, Grid } from 'react-native-svg-charts' | ||
@@ -382,7 +436,9 @@ class LineChartExample extends React.PureComponent { | ||
| <LineChart | ||
| style={ { height: 200 } } | ||
| style={{ height: 200 }} | ||
| data={ data } | ||
| svg={{ stroke: 'rgb(134, 65, 244)' }} | ||
| contentInset={ { top: 20, bottom: 20 } } | ||
| /> | ||
| contentInset={{ top: 20, bottom: 20 }} | ||
| > | ||
| <Grid/> | ||
| </LineChart> | ||
| ) | ||
@@ -398,8 +454,9 @@ } | ||
| #### Arguments to children | ||
| Supports all [Common arguments to children](#common-arguments-to-children) | ||
| ### PieChart | ||
| The PieChart is a really nice component with great support for custom behavior. | ||
| The PieChart does not support the `extras` prop as it doesn't make much sense in the context of a pie chart. | ||
| It does however support the decorator prop with some extra arguments to help you layout your labels (and whatnot). | ||
| See more examples in the [examples repo](https://github.com/JesperLekland/react-native-svg-charts-examples) | ||
@@ -457,3 +514,12 @@ | ||
| #### Arguments to children | ||
| | Property | Description | ||
| | --- | --- | | ||
| | width | the width of the canvas in pixels | ||
| | height | the height of the canvas in pixels | ||
| | slices | an array of the pie chart slices. See source code and examples for what it includes | ||
| | data | the same data array provided to the chart, use this to map over your data points if you want decorators on each point | ||
| ### ProgressCircle | ||
@@ -496,2 +562,11 @@ 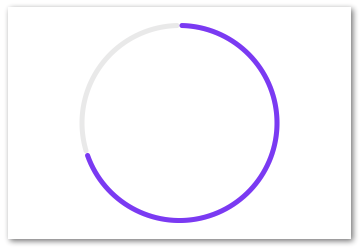 | ||
| #### Arguments to children | ||
| | Property | Description | ||
| | --- | --- | | ||
| | width | the width of the canvas in pixels | | ||
| | height | the height of the canvas in pixels | | ||
| | data | the same data array provided to the chart, use this to map over your data points if you want decorators on each point | | ||
| ### YAxis | ||
@@ -508,3 +583,3 @@ | ||
| import React from 'react' | ||
| import { LineChart, YAxis } from 'react-native-svg-charts' | ||
| import { LineChart, YAxis, Grid } from 'react-native-svg-charts' | ||
| import { View } from 'react-native' | ||
@@ -521,18 +596,21 @@ | ||
| return ( | ||
| <View style={ { height: 200, flexDirection: 'row' } }> | ||
| <View style={{ height: 200, flexDirection: 'row' }}> | ||
| <YAxis | ||
| data={data} | ||
| contentInset={ contentInset } | ||
| svg={{ | ||
| fill: 'grey', | ||
| fontSize: 10, | ||
| }} | ||
| formatLabel={ value => `${value}ºC` } | ||
| data={ data } | ||
| contentInset={ contentInset } | ||
| svg={{ | ||
| fill: 'grey', | ||
| fontSize: 10, | ||
| }} | ||
| numberOfTicks={ 10 } | ||
| formatLabel={ value => `${value}ºC` } | ||
| /> | ||
| <LineChart | ||
| style={ { flex: 1, marginLeft: 16 } } | ||
| data={data} | ||
| style={{ flex: 1, marginLeft: 16 }} | ||
| data={ data } | ||
| svg={{ stroke: 'rgb(134, 65, 244)' }} | ||
| contentInset={ contentInset } | ||
| /> | ||
| > | ||
| <Grid/> | ||
| </LineChart> | ||
| </View> | ||
@@ -561,3 +639,7 @@ ) | ||
| #### Arguments to children | ||
| No arguments | ||
| ### XAxis | ||
@@ -576,3 +658,3 @@ | ||
| import React from 'react' | ||
| import { LineChart, XAxis } from 'react-native-svg-charts' | ||
| import { LineChart, XAxis, Grid } from 'react-native-svg-charts' | ||
| import { View } from 'react-native' | ||
@@ -590,13 +672,15 @@ | ||
| style={{ flex: 1 }} | ||
| data={data} | ||
| gridMin={0} | ||
| data={ data } | ||
| gridMin={ 0 } | ||
| contentInset={{ top: 10, bottom: 10 }} | ||
| svg={{ stroke: 'rgb(134, 65, 244)' }} | ||
| /> | ||
| > | ||
| <Grid/> | ||
| </LineChart> | ||
| <XAxis | ||
| style={{ marginHorizontal: -10 }} | ||
| data={ data } | ||
| formatLabel={ value => index } | ||
| formatLabel={ (value, index) => index } | ||
| contentInset={{ left: 10, right: 10 }} | ||
| svg={{ fontSize: 10 }} | ||
| svg={{ fontSize: 10, fill: 'black' }} | ||
| /> | ||
@@ -623,57 +707,34 @@ </View> | ||
| #### Arguments to children | ||
| ### Decorator | ||
| No arguments | ||
| The `renderDecorator` prop allow for decorations on each of the provided data points. The `renderDecorator` is very similar to the `renderItem` of a [FlatList](https://facebook.github.io/react-native/docs/flatlist.html) | ||
| and is a function that is called with an object as an arguments to help the layout of the extra decorator. The content of the argument object is as follows: | ||
| ### Children | ||
| ```javascript | ||
| { | ||
| value: number, // the value of the data points. Pass to y function to get y coordinate of data point | ||
| index: number, // the index of the data points. Pass to x function to get x coordinate of data point | ||
| x: function, // the function used to calculate the x coordinate of a specific data point index | ||
| y: function, // the function used to calculate the y coordinate of a specific data point value | ||
| } | ||
| ``` | ||
| New for version 5.0. | ||
| Each chart (and axes) component now accepts React children. *Important* note is that all children must be a `react-native-svg` component | ||
| on order for it to be rendered by the chart. This API deprecates the old one with `extras` and `decorators`. | ||
| Everything that should be rendered above or below the chart should now be supplied as a child to said chart. | ||
| This allows you to declare the order in which your decorators should be rendered. If you want anything rendered below the chart, | ||
| simply add the prop `belowChart={true}`. There's a ton of examples in the [examples repo](https://github.com/JesperLekland/react-native-svg-charts-examples), go and have a look. | ||
| Remember that all components returned by `renderDecorator` must be one that is renderable by the [`<Svg/>`](https://github.com/react-native-community/react-native-svg#svg) element, i.e all components supported by [react-native-svg](https://github.com/react-native-community/react-native-svg) | ||
|  | ||
| ### Grid | ||
| [Examples](https://github.com/JesperLekland/react-native-svg-charts-examples) | ||
| This library provides a helper component for drawing grids. | ||
| Simply place it as child to the chart of your choice and (if necessary) set its direction. | ||
| ### Extras | ||
| The `extras` prop allow for arbitrary decorators on your chart. | ||
| and is a function that is called with an object as an arguments to help the layout of the extra decorator. | ||
| This prop is what really makes this library special. With this prop you can customize your charts to your hearts content - gradients, toolTips, clips, images, anything that is supported by `react-native-svg` can be added to your chart through this prop. | ||
| See the [examples repo](https://github.com/JesperLekland/react-native-svg-charts-examples) for some really cool use cases | ||
| #### Props | ||
| The content of the extras argument object is as follows: | ||
| | Property | Default | Description | | ||
| | --- | --- | --- | | ||
| | svg | `{}` | an object containing all the props that should be passed down to the underlying `react-native-svg` component. [See available props](https://github.com/react-native-community/react-native-svg#common-props) | | ||
| | direction | Grid.Direction.HORIZONTAL | The direction of the grid lines. | | ||
| | belowChart | true | whether or not to render below the chart | | ||
| ```javascript | ||
| { | ||
| item: any, // the entry of the 'extras' array | ||
| x: function, // the function used to calculate the x coordinate of a specific data point index | ||
| y: function, // the function used to calculate the y coordinate of a specific data point value | ||
| index: number, // the index of the item in the 'extras' array | ||
| width: number, // the width of the svg canvas, | ||
| height: number, // the number fo the svg canvas, | ||
| } | ||
| ``` | ||
| There might be additional parameters sent to the `extras` functions as well, depending on the chart type. | ||
| ### Examples | ||
| There is a ton of examples over at [react-native-svg-chart-exampels](https://github.com/JesperLekland/react-native-svg-charts-examples) | ||
| The `LineChart` passes the svg path data that rendered the line. (argument name `line`) | ||
| The `AreaChart` passes both the area svg path as well as the | ||
| svg path for the line following the upper bounds of the area. | ||
| (argument name `area` and `line` respectively) | ||
| Take a look in the source code for additional details. | ||
|  | ||
| [Examples](https://github.com/JesperLekland/react-native-svg-charts-examples) | ||
| ## License | ||
| [MIT](./LICENSE) |
@@ -9,3 +9,2 @@ import * as array from 'd3-array' | ||
| import Path from '../animated-path' | ||
| import Grid from '../grid' | ||
@@ -126,10 +125,6 @@ class BarChart extends PureComponent { | ||
| style, | ||
| showGrid, | ||
| numberOfTicks, | ||
| gridProps, | ||
| extras, | ||
| renderDecorator, | ||
| renderGrid = Grid, | ||
| svg, | ||
| horizontal, | ||
| children, | ||
| } = this.props | ||
@@ -162,2 +157,12 @@ | ||
| const extraProps = { | ||
| x, | ||
| y, | ||
| width, | ||
| height, | ||
| bandwidth, | ||
| ticks, | ||
| data, | ||
| } | ||
| return ( | ||
@@ -170,4 +175,10 @@ <View style={ style }> | ||
| <Svg style={{ flex: 1 }}> | ||
| {showGrid && renderGrid({ x, y, ticks, data, gridProps })} | ||
| { | ||
| React.Children.map(children, child => { | ||
| if(child.props.belowChart) { | ||
| return React.cloneElement(child, extraProps) | ||
| } | ||
| }) | ||
| } | ||
| { | ||
| areas.map((area, index) => { | ||
@@ -189,13 +200,9 @@ | ||
| } | ||
| {data.map((item, index) => renderDecorator( | ||
| { | ||
| item, | ||
| x, | ||
| y, | ||
| index, | ||
| bandwidth, | ||
| } | ||
| ))} | ||
| {extras.map((extra, index) => extra({ item: extra, x, y, index, width, height }))} | ||
| { | ||
| React.Children.map(children, child => { | ||
| if(!child.props.belowChart) { | ||
| return React.cloneElement(child, extraProps) | ||
| } | ||
| }) | ||
| } | ||
| </Svg> | ||
@@ -225,9 +232,4 @@ </View> | ||
| numberOfTicks: PropTypes.number, | ||
| showGrid: PropTypes.bool, | ||
| gridMin: PropTypes.number, | ||
| gridMax: PropTypes.number, | ||
| gridProps: PropTypes.object, | ||
| extras: PropTypes.array, | ||
| renderDecorator: PropTypes.func, | ||
| renderGrid: PropTypes.func, | ||
| svg: PropTypes.object, | ||
@@ -241,7 +243,3 @@ } | ||
| numberOfTicks: 10, | ||
| showGrid: true, | ||
| extras: [], | ||
| svg: {}, | ||
| renderDecorator: () => { | ||
| }, | ||
| yAccessor: ({ item }) => item, | ||
@@ -248,0 +246,0 @@ } |
@@ -9,3 +9,2 @@ import * as array from 'd3-array' | ||
| import Path from './animated-path' | ||
| import Grid from './grid' | ||
@@ -39,3 +38,2 @@ class Chart extends PureComponent { | ||
| animationDuration, | ||
| showGrid, | ||
| numberOfTicks, | ||
@@ -50,7 +48,4 @@ contentInset: { | ||
| gridMin, | ||
| renderDecorator, | ||
| extras, | ||
| gridProps, | ||
| svg, | ||
| renderGrid = Grid, | ||
| children, | ||
| } = this.props | ||
@@ -92,5 +87,7 @@ | ||
| const extraData = { | ||
| const extraProps = { | ||
| x, | ||
| y, | ||
| data, | ||
| ticks, | ||
| width, | ||
@@ -105,3 +102,10 @@ height, | ||
| <Svg style={{ flex: 1 }}> | ||
| {showGrid && renderGrid({ x, y, ticks, data, gridProps })} | ||
| { | ||
| React.Children.map(children, child => { | ||
| if (child.props.belowChart) { | ||
| return React.cloneElement(child, extraProps) | ||
| } | ||
| return null | ||
| }) | ||
| } | ||
| <Path | ||
@@ -114,4 +118,10 @@ fill={ 'none' } | ||
| /> | ||
| {data.map((value, index) => renderDecorator({ x, y, value, index }))} | ||
| {extras.map((item, index) => item({ ...extraData, index }))} | ||
| { | ||
| React.Children.map(children, child => { | ||
| if (!child.props.belowChart) { | ||
| return React.cloneElement(child, extraProps) | ||
| } | ||
| return null | ||
| }) | ||
| } | ||
| </Svg> | ||
@@ -144,11 +154,6 @@ </View> | ||
| numberOfTicks: PropTypes.number, | ||
| extras: PropTypes.arrayOf(PropTypes.func), | ||
| renderDecorator: PropTypes.func, | ||
| gridMin: PropTypes.number, | ||
| gridMax: PropTypes.number, | ||
| showGrid: PropTypes.bool, | ||
| gridProps: PropTypes.object, | ||
| renderGrid: PropTypes.func, | ||
@@ -169,4 +174,2 @@ xScale: PropTypes.func, | ||
| numberOfTicks: 10, | ||
| showGrid: true, | ||
| extras: [], | ||
| xScale: scale.scaleLinear, | ||
@@ -176,6 +179,4 @@ yScale: scale.scaleLinear, | ||
| yAccessor: ({ item }) => item, | ||
| renderDecorator: () => { | ||
| }, | ||
| } | ||
| export default Chart |
@@ -5,3 +5,3 @@ import React from 'react' | ||
| const Horizontal = ({ ticks = [], y, gridProps = {} }) => { | ||
| const Horizontal = ({ ticks = [], y, svg }) => { | ||
| return ( | ||
@@ -19,6 +19,5 @@ <G> | ||
| stroke={ 'rgba(0,0,0,0.2)' } | ||
| { ...gridProps } | ||
| { ...svg } | ||
| /> | ||
| )) | ||
| } | ||
@@ -29,3 +28,3 @@ </G> | ||
| const Vertical = ({ ticks, x, gridProps = {} }) => { | ||
| const Vertical = ({ ticks = [], x, svg }) => { | ||
| return ( | ||
@@ -43,3 +42,3 @@ <G> | ||
| stroke={ 'rgba(0,0,0,0.2)' } | ||
| { ...gridProps } | ||
| { ...svg } | ||
| /> | ||
@@ -63,11 +62,10 @@ )) | ||
| Vertical.propTypes = { | ||
| x: PropTypes.func.isRequired, | ||
| dataPoints: PropTypes.array.isRequired, | ||
| gridProps: PropTypes.object, | ||
| x: PropTypes.func, | ||
| dataPoints: PropTypes.array, | ||
| svg: PropTypes.object, | ||
| } | ||
| Horizontal.propTypes = { | ||
| y: PropTypes.func.isRequired, | ||
| ticks: PropTypes.array.isRequired, | ||
| gridProps: PropTypes.object, | ||
| y: PropTypes.func, | ||
| ticks: PropTypes.array, | ||
| } | ||
@@ -80,8 +78,33 @@ | ||
| export default Horizontal | ||
| const Direction = { | ||
| VERTICAL: 'VERTICAL', | ||
| HORIZONTAL: 'HORIZONTAL', | ||
| BOTH: 'BOTH', | ||
| } | ||
| export { | ||
| Horizontal, | ||
| Vertical, | ||
| Both, | ||
| const Grid = ({ direction, ...props }) => { | ||
| if (direction === Direction.VERTICAL) { | ||
| return <Vertical { ...props } /> | ||
| } else if (direction === Direction.HORIZONTAL) { | ||
| return <Horizontal { ...props } /> | ||
| } else if (direction === Direction.BOTH) { | ||
| return <Both { ...props } /> | ||
| } | ||
| return null | ||
| } | ||
| Grid.Direction = Direction | ||
| Grid.propTypes = { | ||
| direction: PropTypes.oneOf(Object.values(Direction)), | ||
| belowChart: PropTypes.bool, | ||
| svg: PropTypes.object, | ||
| } | ||
| Grid.defaultProps = { | ||
| direction: Direction.HORIZONTAL, | ||
| belowChart: true, | ||
| } | ||
| export default Grid |
@@ -11,3 +11,3 @@ import AreaChart from './area-chart' | ||
| import Decorators from './chart-decorators' | ||
| import * as Grid from './grid' | ||
| import Grid from './grid' | ||
| import Path from './animated-path' | ||
@@ -14,0 +14,0 @@ |
@@ -41,5 +41,5 @@ import React, { PureComponent } from 'react' | ||
| style, | ||
| renderDecorator, | ||
| sort, | ||
| valueAccessor, | ||
| children, | ||
| } = this.props | ||
@@ -107,2 +107,17 @@ | ||
| const slices = pieSlices.map((slice, index) =>({ | ||
| ...slice, | ||
| pieCentroid: arcs[index].centroid(slice), | ||
| labelCentroid: labelArcs[index].centroid(slice), | ||
| })) | ||
| const extraProps = { | ||
| width, | ||
| height, | ||
| data, | ||
| slices, | ||
| } | ||
| console.log('pieCentroid', slices.map(item => item.pieCentroid)) | ||
| return ( | ||
@@ -115,2 +130,10 @@ <View style={ style }> | ||
| <Svg style={{ flex: 1 }}> | ||
| { | ||
| React.Children.map(children, child => { | ||
| if (child.props.belowChart) { | ||
| return React.cloneElement(child, extraProps) | ||
| } | ||
| return null | ||
| }) | ||
| } | ||
| <G x={ width / 2 } y={ height / 2 }> | ||
@@ -130,11 +153,11 @@ { pieSlices.map((slice, index) => { | ||
| })} | ||
| { pieSlices.map((slice, index) => renderDecorator({ | ||
| index, | ||
| item: data[ index ], | ||
| height, | ||
| width, | ||
| pieCentroid: arcs[ index ].centroid(slice), | ||
| labelCentroid: labelArcs[ index ].centroid(slice), | ||
| })) } | ||
| </G> | ||
| { | ||
| React.Children.map(children, child => { | ||
| if (!child.props.belowChart) { | ||
| return React.cloneElement(child, extraProps) | ||
| } | ||
| return null | ||
| }) | ||
| } | ||
| </Svg> | ||
@@ -161,3 +184,2 @@ </View> | ||
| style: PropTypes.any, | ||
| renderDecorator: PropTypes.func, | ||
| sort: PropTypes.func, | ||
@@ -174,6 +196,4 @@ valueAccessor: PropTypes.func, | ||
| sort: (a, b) => b.value - a.value, | ||
| renderDecorator: () => { | ||
| }, | ||
| } | ||
| export default PieChart |
@@ -30,2 +30,3 @@ import React, { PureComponent } from 'react' | ||
| animateDuration, | ||
| children, | ||
| } = this.props | ||
@@ -76,2 +77,10 @@ | ||
| const x = width / 2 | ||
| const y = height / 2 | ||
| const extraProps = { | ||
| width, | ||
| height, | ||
| } | ||
| return ( | ||
@@ -83,5 +92,13 @@ <View | ||
| <Svg style={{ flex: 1 }}> | ||
| { | ||
| React.Children.map(children, child => { | ||
| if (child.props.belowChart) { | ||
| return React.cloneElement(child, extraProps) | ||
| } | ||
| return null | ||
| }) | ||
| } | ||
| <G | ||
| x={ width / 2 } | ||
| y={ height / 2 } | ||
| x={ x } | ||
| y={ y } | ||
| > | ||
@@ -100,2 +117,10 @@ {arcs.map((shape, index) => { | ||
| </G> | ||
| { | ||
| React.Children.map(children, child => { | ||
| if (!child.props.belowChart) { | ||
| return React.cloneElement(child, extraProps) | ||
| } | ||
| return null | ||
| }) | ||
| } | ||
| </Svg> | ||
@@ -102,0 +127,0 @@ </View> |
@@ -8,3 +8,2 @@ import PropTypes from 'prop-types' | ||
| import { Defs, G, Svg } from 'react-native-svg' | ||
| import Grid from './grid' | ||
| import Path from './animated-path' | ||
@@ -46,3 +45,2 @@ | ||
| curve, | ||
| showGrid, | ||
| numberOfTicks, | ||
@@ -57,5 +55,3 @@ contentInset: { | ||
| gridMax, | ||
| gridProps, | ||
| renderDecorator, | ||
| extras, | ||
| children, | ||
| offset, | ||
@@ -107,3 +103,3 @@ order, | ||
| const extraData = { | ||
| const extraProps = { | ||
| x, | ||
@@ -113,2 +109,3 @@ y, | ||
| height, | ||
| ticks, | ||
| } | ||
@@ -123,8 +120,9 @@ | ||
| <Svg style={{ flex: 1 }}> | ||
| { showGrid && | ||
| <Grid | ||
| ticks={ ticks } | ||
| y={ y } | ||
| gridProps={ gridProps } | ||
| /> | ||
| { | ||
| React.Children.map(children, child => { | ||
| if (child.props.belowChart) { | ||
| return React.cloneElement(child, extraProps) | ||
| } | ||
| return null | ||
| }) | ||
| } | ||
@@ -154,8 +152,10 @@ { areas.map((area, index) => ( | ||
| ) } | ||
| { series.map((serie) => { | ||
| return data.map((key, index) => { | ||
| return renderDecorator({ x, y, index, value: serie[ index ][ 1 ] }) | ||
| { | ||
| React.Children.map(children, child => { | ||
| if (!child.props.belowChart) { | ||
| return React.cloneElement(child, extraProps) | ||
| } | ||
| return null | ||
| }) | ||
| }) } | ||
| { extras.map((item, index) => item({ ...extraData, index })) } | ||
| } | ||
| </Svg> | ||
@@ -162,0 +162,0 @@ </View> |
@@ -9,3 +9,2 @@ import * as array from 'd3-array' | ||
| import Path from './animated-path' | ||
| import Grid from './grid' | ||
@@ -137,3 +136,2 @@ class BarChart extends PureComponent { | ||
| style, | ||
| showGrid, | ||
| renderGradient, | ||
@@ -143,4 +141,3 @@ numberOfTicks, | ||
| gridMin, | ||
| gridProps, | ||
| extras, | ||
| children, | ||
| horizontal, | ||
@@ -176,2 +173,11 @@ } = this.props | ||
| const extraProps = { | ||
| x, | ||
| y, | ||
| width, | ||
| height, | ||
| ticks, | ||
| data, | ||
| } | ||
| return ( | ||
@@ -181,3 +187,10 @@ <View style={ style }> | ||
| <Svg style={{ flex: 1 }}> | ||
| {showGrid && <Grid y={ y } ticks={ ticks } gridProps={ gridProps } />} | ||
| { | ||
| React.Children.map(children, child => { | ||
| if (child.props.belowChart) { | ||
| return React.cloneElement(child, extraProps) | ||
| } | ||
| return null | ||
| }) | ||
| } | ||
| {areas.map((bar, index) => { | ||
@@ -202,3 +215,10 @@ return ( | ||
| })} | ||
| {extras.map((extra, index) => extra({ item: extra, x, y, index, width, height }))} | ||
| { | ||
| React.Children.map(children, child => { | ||
| if (!child.props.belowChart) { | ||
| return React.cloneElement(child, extraProps) | ||
| } | ||
| return null | ||
| }) | ||
| } | ||
| </Svg> | ||
@@ -205,0 +225,0 @@ </View> |
@@ -63,2 +63,3 @@ import React, { PureComponent } from 'react' | ||
| svg, | ||
| children, | ||
| } = this.props | ||
@@ -90,2 +91,3 @@ | ||
| <Svg style={ StyleSheet.absoluteFill }> | ||
| {children} | ||
| { | ||
@@ -92,0 +94,0 @@ // don't render labels if width isn't measured yet, |
@@ -65,2 +65,3 @@ import React, { PureComponent } from 'react' | ||
| svg, | ||
| children, | ||
| } = this.props | ||
@@ -103,2 +104,3 @@ | ||
| <Svg style={ StyleSheet.absoluteFill }> | ||
| {children} | ||
| { | ||
@@ -105,0 +107,0 @@ // don't render labels if width isn't measured yet, |
Sorry, the diff of this file is not supported yet
New alerts
No v1
QualityPackage is not semver >=1. This means it is not stable and does not support ^ ranges.
Found 1 instance in 1 package
Improved metrics
- Total package byte prevSize
- increased by1.77%
155596
- Number of package files
- increased by4.88%
43
- Lines of code
- increased by5.78%
2012
- Number of lines in readme file
- increased by9.3%
717
Worsened metrics
- Number of low quality alerts
- increased byInfinity%
1