Product
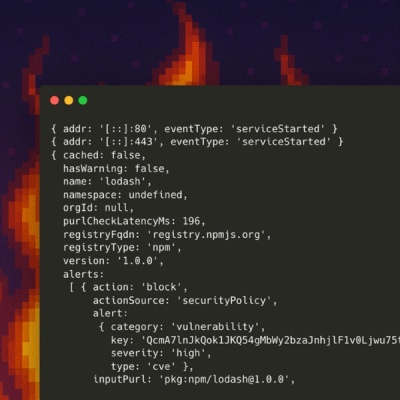
Introducing Socket Firewall Enterprise: Flexible, Configurable Protection for Modern Package Ecosystems
Socket Firewall Enterprise is now available with flexible deployment, configurable policies, and expanded language support.
the #d3js bl.ock Animated ROC Chart packaged up as an node module.
to install rocChart:
$ npm i rocChart --save
then, in your project:
import rocChart from 'rocChart';

export function drawROCChart() {
  const data = // your data

  rocChart.plot('body', data, options);
}

pass an options object containing the values for these propteries to configure the ROC Chart:
curveColors an array of strings containing CSS color names or color hex codes. the values in this array are used to set the stroke color of each ROC curve.
'curveColors': ['blue', 'orange', 'steelblue', 'red', 'green', 'purple']
TODO: document remaining options
FAQs
a chart that plots receiver operating characteristic curves
We found that roc-chart demonstrated a not healthy version release cadence and project activity because the last version was released a year ago. It has 1 open source maintainer collaborating on the project.
Did you know?

Socket for GitHub automatically highlights issues in each pull request and monitors the health of all your open source dependencies. Discover the contents of your packages and block harmful activity before you install or update your dependencies.

Product
Socket Firewall Enterprise is now available with flexible deployment, configurable policies, and expanded language support.

Security News
Open source dashboard CNAPulse tracks CVE Numbering Authorities’ publishing activity, highlighting trends and transparency across the CVE ecosystem.

Product
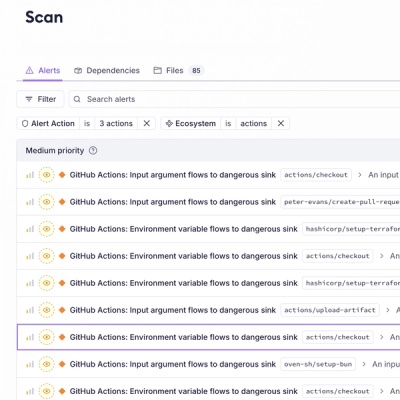
Detect malware, unsafe data flows, and license issues in GitHub Actions with Socket’s new workflow scanning support.