Product
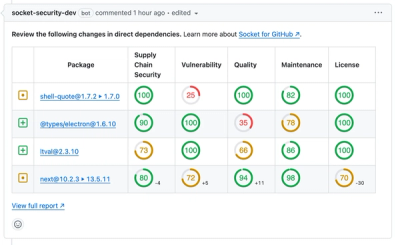
A New Design for GitHub PR Comments
We redesigned our GitHub PR comments to deliver clear, actionable security insights without adding noise to your workflow.
By André Staltz - Apr 10, 2025
Vizzu is a free, open-source Javascript/C++ library utilizing a generic dataviz engine that generates many types of charts and seamlessly animates between them. It can be used to create static charts but more importantly it is designed for building animat

Vizzu - Library for animated data visualizations and data stories.
Documentation · Examples · Code reference · Repository · Blog
![]()

Vizzu is a free, open-source Javascript/C++ library utilizing a generic dataviz engine that generates many types of charts and seamlessly animates between them. It can be used to create static charts but more importantly, it is designed for building animated data stories and interactive explorers as Vizzu enables showing different perspectives of the data that the viewers can easily follow due to the animation.
Main features:
Install via npm:
npm install vizzu
Or use it from CDN:
<html>
 <head>
  <script type="module">
   import Vizzu from 'https://cdn.jsdelivr.net/npm/vizzu@0.16/dist/vizzu.min.js';
  </script>
 </head>
</html>
Create a placeholder element that will contain the rendered chart:
<html>
 <body>
  <div id="myVizzu" style="width:800px; height:480px;">
  </div>
 </body>
</html>
Create a simple bar chart:
import Vizzu from 'https://cdn.jsdelivr.net/npm/vizzu@0.16/dist/vizzu.min.js';

let data = {
    series: [{
        name: 'Foo',
        values: ['Alice', 'Bob', 'Ted']
    }, {
        name: 'Bar',
        values: [15, 32, 12]
    }, {
        name: 'Baz',
        values: [5, 3, 2]
    }]
};

let chart = new Vizzu('myVizzu', {
    data
});
chart.animate({
    x: 'Foo',
    y: 'Bar'
});
Then turn it into a scatter plot:
chart.animate({
    color: 'Foo',
    x: 'Baz',
    geometry: 'circle'
});
You can find answers to the most frequently asked questions about using the library in our FAQ.
List of external projects (extensions, bindings, templates, etc) for Vizzu: Projects.
We have a comprehensive list of features we plan to implement, on our Roadmap.
We welcome contributions to the project, visit our contributing guide for further info.
Copyright © 2021-2024 Vizzu Inc.
Released under the Apache 2.0 License.
FAQs
Vizzu is a free, open-source Javascript/C++ library utilizing a generic dataviz engine that generates many types of charts and seamlessly animates between them. It can be used to create static charts but more importantly it is designed for building animat
We found that vizzu demonstrated a healthy version release cadence and project activity because the last version was released less than a year ago. It has 3 open source maintainers collaborating on the project.
Did you know?

Socket for GitHub automatically highlights issues in each pull request and monitors the health of all your open source dependencies. Discover the contents of your packages and block harmful activity before you install or update your dependencies.
Product
We redesigned our GitHub PR comments to deliver clear, actionable security insights without adding noise to your workflow.
Product
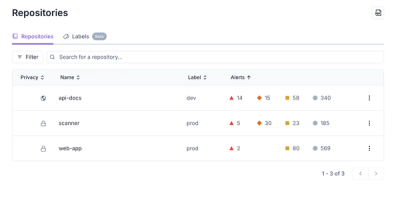
Our redesigned Repositories page adds alert severity, filtering, and tabs for faster triage and clearer insights across all your projects.

Security News
Slopsquatting is a new supply chain threat where AI-assisted code generators recommend hallucinated packages that attackers register and weaponize.