Security Fundamentals
Turtles, Clams, and Cyber Threat Actors: Shell Usage
The Socket Threat Research Team uncovers how threat actors weaponize shell techniques across npm, PyPI, and Go ecosystems to maintain persistence and exfiltrate data.
"abroca" is a python package to provide basic functionality for computing and visualizing the Absolute Between-ROC Area (ABROCA).
The source code is currently hosted on github and Python package at PyPi
# PyPI
pip install abroca
You can find the .ipynb file under example folder. It is a basic example which demonstrates the use of the abroca package to compute the ABROCA for a simple logistic regression classifier.
#Compute Abroca
slice = compute_abroca(df_test, pred_col = 'pred_proba' , label_col = 'returned',
                       protected_attr_col = 'Gender', compare_type = 'binary',
                       n_grid = 10000, plot_slices = True)

The plot is automatically saved to a file and is displayed on-screen. The link to download the data is given in the comments in the example file. Parameters are self explainatory through the example file. Parameter details below.
Reference Paper: Josh Gardner, Christopher Brooks, and Ryan Baker (2019). Evaluating the Fairness of Predictive Student Models Through Slicing Analysis. Proceedings of the 9th International Conference on Learning Analytics and Knowledge (LAK19); March 4-8, 2019; Tempe, AZ, USA. https://doi.org/10.1145/3303772.3303791
If you encounter a clear bug, please file a minimal reproducible example on github, or contact the package maintainers directly (see the package documentation).
FAQs
package for computing and visualizing the Absolute Between-ROC Area (ABROCA)
We found that abroca demonstrated a healthy version release cadence and project activity because the last version was released less than a year ago. It has 1 open source maintainer collaborating on the project.
Did you know?

Socket for GitHub automatically highlights issues in each pull request and monitors the health of all your open source dependencies. Discover the contents of your packages and block harmful activity before you install or update your dependencies.

Security Fundamentals
The Socket Threat Research Team uncovers how threat actors weaponize shell techniques across npm, PyPI, and Go ecosystems to maintain persistence and exfiltrate data.

Security News
At VulnCon 2025, NIST scrapped its NVD consortium plans, admitted it can't keep up with CVEs, and outlined automation efforts amid a mounting backlog.

Product
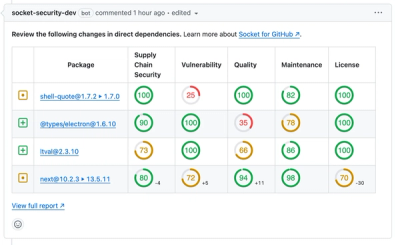
We redesigned our GitHub PR comments to deliver clear, actionable security insights without adding noise to your workflow.