
Research
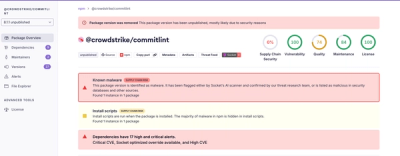
Malicious fezbox npm Package Steals Browser Passwords from Cookies via Innovative QR Code Steganographic Technique
A malicious package uses a QR code as steganography in an innovative technique.
By Olivia Brown - Sep 22, 2025
codeplot-ipython
Advanced tools
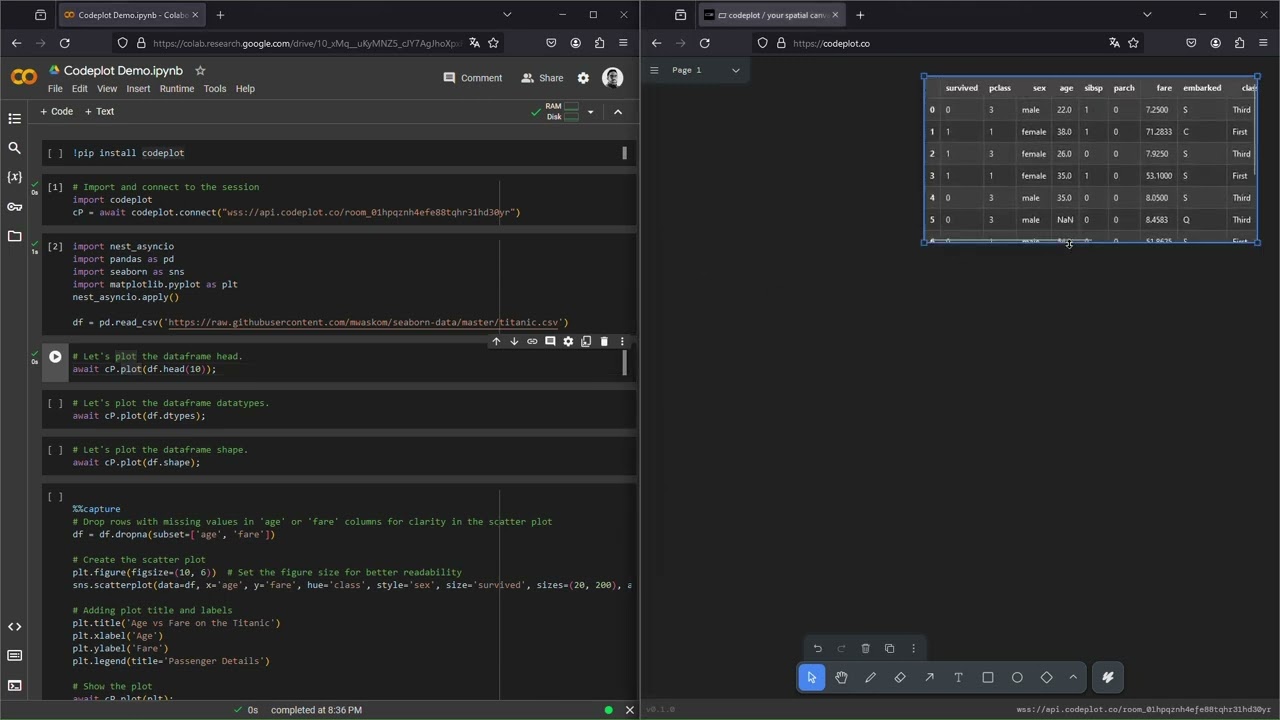
codeplot is a canvas designed for code-driven data exploration where you can plot graphs, data frames, markdown and much more using plain Python
codeplot is a dynamic spatial canvas for data exploration, offering an interactive environment for graphing and visualizing data with Python.
Created by @antl3x, read more about its inception.
Why Choose codeplot?
Dynamic Visualization: Break free from static images and rigid layouts. codeplot brings your data to life on an interactive canvas.
Easy Integration: Directly plot from your Python code or REPL into your canvas at codeplot.co.
Varied Visualizations: From basic charts to advanced widgets, codeplot supports a wide range of data representations.
Flexible Layouts: Arrange your visualizations to suit your workflow, with draggable and movable plots.
Open to Everyone: Designed for data scientists and enthusiasts alike, codeplot aims to enhance your data exploration experience.
To use codeplot in a IPython Notebook like Jupyter, Google Colab, etc, you can install the IPython Extension using pip:
pip install codeplot-ipython
After install you can load the extension and connect to a new room:
%load_ext codeplot-ipython
%cP_connect ws://your-ws-url/your-room-id
Now the output of your cells will be automatically plotted in the codeplot canvas! So you don't need to use the cP.plot function.
Thats all!
If you want to use codeplot in a Python script, and have a more "fine-grained" control over the plots, you can use the Python SDK.
To get started with codeplot, you can install the package using pip:
pip install codeplot
Once installed, you can start using codeplot by importing the package and connectig to a new room:
import asyncio
import codeplot

async def main():
    cP = await codeplot.connect("ws://your-ws-url/your-room-id")

    # Now you can start plotting
    await cP.plot(df.describe())
    await cP.plot(df.head(10))
    await cP.plot(df)

asyncio.run(main())
You can use the public codeplot client & server to start plotting right away:
If you want to use codeplot in a Jupyter Notebook, you can use the following code:
import codeplot
cP = await codeplot.connect("ws://your-ws-url/your-room-id")

# Now you can start plotting
await cP.plot(df.describe())
await cP.plot(df.head(10))
await cP.plot(df)
Instead of using the public codeplot server, you can self-host and run codeplot on your local machine using Docker. To do so, you can use the following command:
curl -s https://raw.githubusercontent.com/codeplot-co/codeplot/master/minirepos/@codeplot-docker/docker-compose.yaml | docker-compose -f - up
Or if you are using docker-compose v2, you can use the following command instead
curl -s https://raw.githubusercontent.com/codeplot-co/codeplot/master/minirepos/@codeplot-docker/docker-compose.yaml | docker compose -f - up
This will start a codeplot server and a client on your local machine, and you can access it at:
Join the codeplot Community
Become part of a forward-thinking community dedicated to advancing data visualization. Connect, engage, and grow with peers on Discord. With codeplot, data visualization is a shared journey. Let's explore new insights together!
Codeplot is crafted to support a wide range of users, from individuals exploring their personal projects to enterprises seeking to enhance their business processes. To accommodate this diversity, Codeplot adopts a dual-license approach.
Codeplot is free to use for personal and non-commercial purposes.
Only pay if you use Codeplot commercially.
Read more about License and Pricing here.
This project is sponsored by LearnPolars.co. LearnPolars is a platform to learn data manipulation and analysis using Polars, a blazingly fast DataFrame library in Python (Rust).
FAQs
codeplot is a canvas designed for code-driven data exploration where you can plot graphs, data frames, markdown and much more using plain Python
We found that codeplot-ipython demonstrated a healthy version release cadence and project activity because the last version was released less than a year ago. It has 1 open source maintainer collaborating on the project.
Did you know?

Socket for GitHub automatically highlights issues in each pull request and monitors the health of all your open source dependencies. Discover the contents of your packages and block harmful activity before you install or update your dependencies.
Research
A malicious package uses a QR code as steganography in an innovative technique.

Research
/Security News
Socket identified 80 fake candidates targeting engineering roles, including suspected North Korean operators, exposing the new reality of hiring as a security function.
Application Security
/Research
/Security News
Socket detected multiple compromised CrowdStrike npm packages, continuing the "Shai-Hulud" supply chain attack that has now impacted nearly 500 packages.