Company News
Socket Has Acquired Secure Annex
Socket has acquired Secure Annex to expand extension security across browsers, IDEs, and AI tools.
hilda
Advanced tools
Hilda is a debugger which combines both the power of LLDB and iPython for easier debugging.
The name originates from the TV show "Hilda", which is the best friend of Frida. Both Frida and Hilda are meant for pretty much the same purpose, except Hilda takes the more " debugger-y" approach (based on LLDB).
Currently, the project is intended for iOS/OSX debugging, but in the future we will possibly add support for the following platforms as well:
Since LLDB allows abstraction for both platform and architecture, it should be possible to make the necessary changes without too many modifications.
Pull requests are more than welcome 😊.
If you need help or have an amazing idea you would like to suggest, feel free to start a discussion 💬.
Requirements for remote iOS device (not required for debugging a local OSX process):
debugserver in device's PATH
/usr/bin/debugserverIn order to install please run:
xcrun python3 -m pip install --user -U hilda
⚠️ Please note that Hilda is installed on top of XCode's python so LLDB will be able to use its features.
You can may start a Hilda interactive shell by invoking any of the subcommand:
hilda launch /path/to/executable
hilda attach [-p pid] [-n process-name]
pid or process-name)hilda remote HOSTNAME PORT
HOSTNAME PORT)hilda bare
Only start an LLDB shell and load Hilda as a plugin.
Please refer to the following help page if you require help on the command available to you within the lldb shell:
As a cheatsheet, connecting to a remote platform like so:
platform connect connect://ip:port
... and attaching to a local process:
process attach -n process_name
process attach -p process_pid
When you are ready, just execute hilda to move to Hilda's iPython shell.
Upon starting Hilda, you are welcomed into an IPython shell.
You can access following methods via the variable p.
Basic flow control:
stop - Stop processcont - Continue processfinish - Run current function until returnstep_into - Step into current instructionstep_over - Step over current instruction.run_for - Run the process for given intervalforce_return - Prematurely return from a stack frame, short-circuiting execution of inner
frames and optionally yielding a specified value.jump - Jump to given symbolwait_for_module - Wait for a module to be loaded (dlopen) by checking if given expression is contained within its filenamedetach - Detach from process (useful for exiting gracefully so the
process doesn't get killed when you exit)Breakpoints:
bp or breakpoints.add - Add a breakpointbreakpoints.show - Show existing breakpointsbreakpoints.remove - Remove a single breakpointbreakpoints.clear - Remove all breakpointsmonitor or breakpoints.add_monitor - Creates a breakpoint whose callback implements the requested features (print register values, execute commands, mock return value, etc.)Basic read/write:
get_register - Get register value
set_register - Set register value
poke - Write data at address
peek[_str,_std_str] - Read buffer/C-string/std::string at address
po - Print object using LLDB's po command
Can also run arbitrary native code:
p.po('NSMutableString *s = [NSMutableString string]; [s appendString:@"abc"]; [s description]')
disass - Print disassembly at address
show_current_source - Print current source code (if possible)
bt - Get backtrace
lsof - Get all open FDs
hd - Hexdump a buffer
proc_info - Print information about currently running mapped process
print_proc_entitlements - Get the plist embedded inside the process' __LINKEDIT section.
Execute code:
call - Call function at given address with given parametersobjc_call - Simulate a call to an objc selectorinject - Inject a single library into currently running processdisable_jetsam_memory_checks -
Disable jetsam memory checks (to prevent raising
error: Execution was interrupted, reason: EXC_RESOURCE RESOURCE_TYPE_MEMORY (limit=15 MB, unused=0x0).
when evaluating expressions).Hilda symbols:
symbol - Get symbol object for a given addressobjc_symbol - Get objc symbol wrapper for given addressfile_symbol - Calculate symbol address without ASLRsave - Save loaded symbols map (for loading later using the load() command)load - Load an existing symbols map (previously saved by the save() command)globalize_symbols - Make all symbols in python's global scopeAdvanced:
lldb_handle_command - Execute an LLDB command (e.g., p.lldb_handle_command('register read'))
evaluate_expression - Use for quick code snippets (wrapper for LLDB's EvaluateExpression)
Take advantage of local variables inside the expression using format string, e.g.,
currentDevice = p.objc_get_class('UIDevice').currentDevice
p.evaluate_expression(f'[[{currentDevice} systemName] hasPrefix:@"2"]')
import_module - Import & reload given python module (intended mainly for external snippets)
unwind - Unwind the stack (useful when get_evaluation_unwind() == False)
set_selected_thread - sets the currently selected thread, which is used in other parts of the program, such as displaying disassembly or
checking registers.
This ensures the application focuses on the specified thread for these operations.
Objective-C related:
objc_get_class - Get ObjC class objectCFSTR - Create CFStringRef object from given stringns - Create NSObject from given datafrom_ns - Create python object from NS object.Sometimes accessing the Python API can be tiring, so we added some magic functions to help you out!
%objc <className>
className = p.objc_get_class(className)%fbp <filename> <addressInHex>
p.file_symbol(addressInHex, filename).bp()The global cfg used to configure various settings for evaluation and monitoring.
These settings include:
evaluation_unwind_on_error: Whether to unwind on error during evaluation. (Default: False)evaluation_ignore_breakpoints: Whether to ignore breakpoints during evaluation. (Default: False)nsobject_exclusion: Whether to exclude NSObject during evaluation, reducing IPython autocomplete results. (
Default: False)objc_verbose_monitor: When set to True, using monitor() will automatically print Objective-C method arguments. (
Default: False)Hilda contains a minimal UI for examining the target state. The UI is divided into views:

This UI can be displayed at any time be executing:
ui.show()
By default step_into and step_over will show this UI automatically.
You may disable this behavior by executing:
ui.active = False
Attentively, if you want to display UI after hitting a breakpoint, you can register ui.show as callback:
p.symbol(0x7ff7b97c21b0).bp(ui.show)
Try playing with the UI settings by yourself:
# Disable stack view
ui.views.stack.active = False

# View words from the stack
ui.views.stack.depth = 10

# View last 10 frames
ui.views.backtrace.depth = 10

# Disassemble 5 instructions
ui.views.disassembly.instruction_count = 5

# Change disassembly syntax to AT&T
ui.views.disassembly.flavor = 'att'

# View floating point registers
ui.views.registers.rtype = 'float'

# Change addresses print color
ui.colors.address = 'red'

# Change titles color
ui.color.title = 'green'
Hilda provides a comprehensive API wrappers to access LLDB capabilities. This API may be used to access process memory, trigger functions, place breakpoints and much more!
Also, in addition to access this API using the Hilda shell, you may also use pure-python script using any of the create_hilda_client_using_* APIs.
Consider the following snippet as an example of such usage:
from hilda.launch_lldb import create_hilda_client_using_attach_by_name

# attach to `sysmond`
p = create_hilda_client_using_attach_by_name('sysmond')

# allocate 10 bytes and print their address
print(p.symbols.malloc(10))

# detach
p.detach()
Please note this script must be executed using xcrun python3 in order for it to be able to access LLDB API.
In Hilda, almost everything is wrapped using the Symbol Object. Symbol is just a nicer way for referring to addresses
encapsulated with an object allowing to deref the memory inside, or use these addresses as functions.
In order to create a symbol from a given address, please use:
s = p.symbol(0x12345678)

# the Symbol object extends `int`
True == isinstance(s, int)

# print the un-shifted file address
# (calculating the ASLR shift for you, so you can just view it in IDA)
print(s.file_address)

# or.. if you know the file address, but don't wanna mess
# with ASLR calculations
s = p.file_symbol(0x12345678)

# peek(/read) 20 bytes of memory
print(s.peek(20))

# write into this memory
s.poke('abc')

# let LLDB print-object (it should guess the type automatically
# based on its memory layout)
print(s.po())

# or you can help LLDB with telling it its type manually
print(s.po('char *'))

# jump to `s` as a function, passing (1, "string") as its args
s(1, "string")

# change the size of each item_size inside `s` for derefs
s.item_size = 1

# *(char *)s = 1
s[0] = 1

# *(((char *)s)+1) = 1
s[1] = 1

# symbol inherits from int, so all int operations apply
s += 4

# change s item size back to 8 to store pointers
s.item_size = 8

# *(intptr_t *)s = 1
s[0] = 1

# storing the return value of the function executed at `0x11223344`
# into `*s`
s[0] = p.symbol(0x11223344)()  # calling symbols also returns symbols

# attempt to resolve symbol's name
print(p.symbol(0x11223344).lldb_address)

# monitor each time a symbol is called into console and print its backtrace (`bt` option)
# this will create a scripted breakpoint which prints your desired data and continue
s.monitor(bt=True)

# you can also:
#   bt -> view the backtrace
#   regs -> view registers upon each call in your desired format
#   retval -> view the return value upon each call in your desired format
#   cmd -> execute a list of LLDB commands on each hit
s.monitor(regs={'x0': 'x'},  # print `x0` in HEX form
          retval='po',  # use LLDB's `po` for printing the returned value
          bt=True,  # view backtrace (will also resolve ASLR addresses for you)
          cmd=['thread list'],  # show thread list
          )

# we can also just `force_return` with a hard-coded value to practically disable
# a specific functionality
s.monitor(force_return=0)  # cause the function to always return `0`

# as for everything, if you need help understanding each such feature,
# simply execute the following to view its help (many such features even contain examples)
s.monitor?

# create a scripted_breakpoint manually
def scripted_breakpoint(hilda, *args):
    # like everything in hilda, registers are also
    # just simple `Symbol` objects, so feel free to
    # use them to your heart's content :)
    if hilda.registers.x0.peek(4) == b'\x11\x22\x33\x44':
        hilda.registers.x0 = hilda.symbols.malloc(200)
        hilda.registers.x0.poke(b'\x22' * 200)

    # just continue the process
    hilda.cont()


s.bp(scripted_breakpoint)

# Place a breakpoint at a symbol not yet loaded by it's name
p.bp('symbol_name')

# In case you need to specify a specific library it's loaded from
p.bp(('symbol_name', 'ModuleName'))
Usually you would want/need to use the symbols already mapped into the currently running process. To do so, you can
access them using symbols.<symbol-name>. The symbols global object is of type SymbolList, which acts like
dict for accessing all exported symbols. For example, the following will generate a call to the exported
malloc function with 20 as its only argument:
x = p.symbols.malloc(20)
You can also just write their name as if they already were in the global scope. Hilda will check if no name collision exists, and if so, will perform the following lazily for you:
x = malloc(20)

# is equivalent to:
malloc = p.symbols.malloc
x = malloc(20)
Sometimes you don't really know where to start your research. All you have is just theories of how your desired exported symbol should be called (if any).
# find all symbols prefixed as `mem*` AND don't have `cpy`
# in their name
l = p.symbols.filter_startswith('mem') - p.symbols.filter_name_contains('cpy')

# filter only symbols of type "code" (removing data global for example)
l = l.filter_code_symbols()

# monitor every time each one is called, print its `x0` in HEX
# form and show the backtrace
l.monitor(regs={'x0': 'x'}, bt=True)
The same as symbols applies to Objective-C classes name resolution. You can either:
d = NSDictionary.new()  # call its `new` selector

# which is equivalent to:
NSDictionary = p.objc_get_class('NSDictionary')
d = NSDictionary.new()

# Or you can use the IPython magic function
%objc
NSDictionary
This is possible only since NSDictionary is exported. In case it is not, you must call objc_get_class() explicitly.
As you can see, you can directly access all the class' methods.
Please look what more stuff you can do as shown below:
# show the class' ivars
print(NSDictionary.ivars)

# show the class' methods
print(NSDictionary.methods)

# show the class' properties
print(NSDictionary.properties)

# view class' selectors which are prefixed with 'init'
print(NSDictionary.methods.filter_startswith('init'))

# you can of course use any of `SymbolList` over them, for example:
# this will `po` (print object) all those selectors returned value
NSDictionary.methods.filter_startswith('init').monitor(retval='po')

# monitor each time any selector in NSDictionary is called
NSDictionary.monitor()

# `force_return` for some specific selector with a hard-coded value (4)
NSDictionary.methods.get('valueForKey:').address.monitor(force_return=4)

# capture the `self` object at the first hit of any selector
# `True` for busy-wait for object to be captured
dictionary = NSDictionary.capture_self(True)

# print a colored and formatted version for class layout
dictionary.show()
In order to work with ObjC objects, each symbol contains a property called
objc_symbol. After calling, you can work better with each object:
dict = NSDictionary.new().objc_symbol
dict.show()  # print object layout

# just like class, you can access its ivars, method, etc...
print(dict.ivars)

# except now they have values you can view
print(dict._ivarName)

# or edit
dict._ivarName = value

# and of course you can call the object's methods
# hilda will checks if the method returned an ObjC object:
#   - if so, call `objc_symbol` upon it for you
#   - otherwise, leave it as a simple `Symbol` object
arr = dict.objectForKey_('keyContainingNSArray')

# you can also call class-methods
# hilda will call it using either the instance object,
# or the class object respectively of the use
newDict = dict.dictionary()

# print the retrieved object
print(arr.po())
Also, working with Objective-C objects like this can be somewhat exhausting, so we created the ns and from_ns
commands so you are able to use complicated types when parsing values and passing as arguments:
import datetime

# using the `ns` command we can just pass a python-native dictionary
function_requiring_a_specfic_dictionary(p.cf({
    'key1': 'string',  # will convert to NSString
    'key2': True,  # will convert to NSNumber
    'key3': b'1234',  # will convert to NSData
    'key4': datetime.datetime(2021, 1, 1)  # will convert to NSDate
}))

# and also parse one
normal_python_dict = p.cf({
    'key1': 'string',  # will convert to NSString
    'key2': True,  # will convert to NSNumber
    'key3': b'1234',  # will convert to NSData
    'key4': datetime.datetime(2021, 1, 1)  # will convert to NSDate
}).py()
On last resort, if the object is not serializable for this to work, you can just run pure Objective-C code:
# let LLDB compile and execute the expression
abc_string = p.evaluate_expression('[NSString stringWithFormat:@"abc"]')

# will print "abc"
print(abc_string.po())
Snippets are extensions for normal functionality used as quick cookbooks for day-to-day tasks of a debugger.
They all use the following concept to use:
from hilda.snippets import snippet_name

snippet_name.do_something()
For example, XPC sniffing can be done using:
from hilda.snippets import xpc

xpc.sniff_all()
This will monitor all XPC related traffic in the given process.
Please run the tests as follows before submitting a PR:
xcrun python3 -m pytest
FAQs
LLDB wrapped and empowered by iPython's features
We found that hilda demonstrated a healthy version release cadence and project activity because the last version was released less than a year ago. It has 1 open source maintainer collaborating on the project.
Did you know?

Socket for GitHub automatically highlights issues in each pull request and monitors the health of all your open source dependencies. Discover the contents of your packages and block harmful activity before you install or update your dependencies.

Company News
Socket has acquired Secure Annex to expand extension security across browsers, IDEs, and AI tools.

Research
/Security News
Socket is tracking cloned Open VSX extensions tied to GlassWorm, with several updated from benign-looking sleepers into malware delivery vehicles.

Product
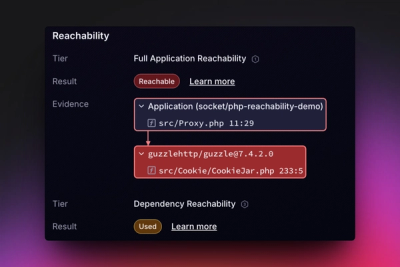
Reachability analysis for PHP is now available in experimental, helping teams identify which vulnerabilities are actually exploitable.