Security Fundamentals
Turtles, Clams, and Cyber Threat Actors: Shell Usage
The Socket Threat Research Team uncovers how threat actors weaponize shell techniques across npm, PyPI, and Go ecosystems to maintain persistence and exfiltrate data.
Create real-time plots in Jupyter notebooks.
It generalises Andreas Madsen's excellent python-lrcurve library for machine learning to produce visualisations for arbitrary functions in real-time.

pip install jupyterplot
Creating a simple real-time plot in a Jupyter notebook is as easy as easy as the following snippet:
from jupyterplot import ProgressPlot
import numpy as np

pp = ProgressPlot()
for i in range(1000):
    pp.update(np.sin(i / 100))
pp.finalize()

Note: The pp.finalize() statement is necessary to make the plots persistent between notebook sessions.
By default, the x and y ranges adapt to new data points. If the scale is known beforehand, it can be steadier to set it beforehand:
pp = ProgressPlot(x_lim=[0, 1000], y_lim=[-1.5, 1.5])
for i in range(1000):
    pp.update(np.sin(i / 100))
pp.finalize()

One can also plot several lines in parallel by specifying the line names in the constructor and passing all values in a list.
pp = ProgressPlot(line_names=["lin", "log", "cos", "sin"],
                  x_lim=[0, 1000],
                  y_lim=[-1, 4])

for i in range(1000):
    pp.update([[i / 250, np.log10(i + 1), np.cos(i / 100), np.sin(i / 100)]])
pp.finalize()

Note: The data is fed to pp.update() as a list of lists, where each sublist corresponds to the curves that are generated in each subplot.
pp = ProgressPlot(plot_names=["cos", "sin"],
                  line_names=["data", "delayed-data"],
                  x_lim=[0, 1000],
                  y_lim=[-1, 1])

for i in range(1000):
    pp.update([[np.cos(i / 100), np.cos((i + 20) / 100)],
               [np.sin(i / 100), np.sin((i + 20) / 100)]])
pp.finalize()

If the x values should not be incremented by 1 at every update one can set the x_iterator=False. This requires passing two values to the update(x, y), where x is an int or float and y follows the same format as in the previous examples.
pp = ProgressPlot(x_iterator=False, x_label="custom-x", x_lim=[0, 10000], y_lim=[0, 10])
for i in range(1000):
    pp.update(10 * i, i / 100)
pp.finalize()

If each subplot should have different y-limits then the y-limits can be passed as a list containing the the limits for each subplot.
pp = ProgressPlot(plot_names=['plot 1', 'plot 2'], x_lim=[0, 1000], y_lim=[[0, 10],[0, 100]])
for i in range(1000):
    pp.update([[(i/100)], [(i/100)**2]])

If the progress plot consists of a single plot with a single line one can pass the y-updates as int or float.
If multiple plots or lines are used, the y-updates can either be lists or dicts:
y_update_list = [[y_plot_1_line_1, y_plot_1_line_2],
                 [y_plot_2_line_1, y_plot_2_line_2]]

y_update_dict = {'plot_name_1': {'line_name_1': y_plot_1_line_1,
                                 'line_name_2': y_plot_1_line_2},
                 'plot_name_2': {'line_name_1': y_plot_2_line_1,
                                 'line_name_2': y_plot_2_line_2}}
ProgressPlot() object can be used at a time.FAQs
Create real-time plots in Jupyter Notebooks.
We found that jupyterplot demonstrated a healthy version release cadence and project activity because the last version was released less than a year ago. It has 1 open source maintainer collaborating on the project.
Did you know?

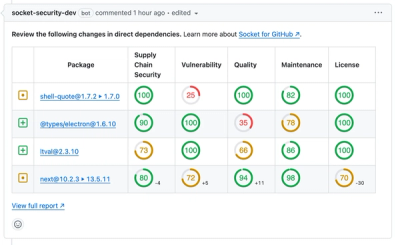
Socket for GitHub automatically highlights issues in each pull request and monitors the health of all your open source dependencies. Discover the contents of your packages and block harmful activity before you install or update your dependencies.

Security Fundamentals
The Socket Threat Research Team uncovers how threat actors weaponize shell techniques across npm, PyPI, and Go ecosystems to maintain persistence and exfiltrate data.

Security News
At VulnCon 2025, NIST scrapped its NVD consortium plans, admitted it can't keep up with CVEs, and outlined automation efforts amid a mounting backlog.

Product
We redesigned our GitHub PR comments to deliver clear, actionable security insights without adding noise to your workflow.