Research
/Security News
Critical Vulnerability in NestJS Devtools: Localhost RCE via Sandbox Escape
A flawed sandbox in @nestjs/devtools-integration lets attackers run code on your machine via CSRF, leading to full Remote Code Execution (RCE).
This example demonstrates how to use the lcrpm package to extract and analyze real-world healthcare data for lung cancer risk modeling using an OMOP Common Data Model (CDM) instance.
Ensure the package is installed and you have a properly configured .env file containing your database connection details.
import lcrpm
from sqlalchemy import inspect

# Load database configuration and create SQLAlchemy engine
config = lcrpm.load_config(".env")
engine = lcrpm.create_engine_from_config(config)

# Extract the time-to-event dataset
df = lcrpm.extract_tte_dataset(engine)
print(f"Dataset shape: {df.shape}")
print(df.head())

# Initialize the OMOP analyzer
analyzer = lcrpm.OMOPAnalyzer(config)
# Disease metadata
disease_name = "lung_cancer"
DB_NAME_TITLE = "Lung Cancer"
FIGURES_DIR = "./FIGURES"

# ICD codes for lung cancer
LC_ICD_Codes = [
    "162.0", "162.2", "162.3", "162.4", "162.5", "162.8", "162.9",
    "C33", "C34.0", "C34.00", "C34.01", "C34.02", "C34.1", "C34.10",
    "C34.11", "C34.12", "C34.2", "C34.3", "C34.30", "C34.31", "C34.32",
    "C34.8", "C34.80", "C34.81", "C34.82", "C34.9", "C34.90", "C34.91", "C34.92"
]

# Generate Kaplan–Meier plot
lcrpm.plot_km_simple(
    df,
    subgroup_label=DB_NAME_TITLE,
    title=f"Kaplan–Meier Survival Curves – {DB_NAME_TITLE}",
    output_png=f"{FIGURES_DIR}/kaplan_meier_professional.png",
    output_pdf=None,
    show=True,
    save=True
)
# Inspect OMOP schema
inspector = inspect(engine)
schema_check = analyzer.inspect_omop_schema(inspector, engine, config['db_schema'])

# Perform descriptive analyses
df_age = analyzer.get_age_distribution(engine, config['federated_node_id'], save=True)
df_summary = analyzer.get_summary_statistics(engine, config['federated_node_id'], save=True)
df_demographics = analyzer.get_demographics_summary(engine, config['federated_node_id'], save=True)
df_locations = analyzer.get_location_distribution(engine, config['federated_node_id'], save=True)
df_visits = analyzer.get_visit_distribution(engine, config['federated_node_id'], save=True)
df_conditions = analyzer.get_condition_distribution(engine, config['federated_node_id'], save=True)
df_drugs = analyzer.get_drug_distribution(engine, config['federated_node_id'], save=True)

# Lung cancer-specific analyses
df_lc_conditions = analyzer.get_lc_condition_distribution(engine, config['federated_node_id'], LC_ICD_Codes, save=True)
df_incident = analyzer.get_incident_rates(engine, config['federated_node_id'], LC_ICD_Codes, save=True)
df_km = analyzer.get_kaplan_meier_data(engine, config['federated_node_id'], LC_ICD_Codes, save=True)

# Smoking status analysis
smoking_codes = [1568177, 45538046, 45595884, 45562025, 45542821, 45591117, 45600719, 1568178, 43021779]
df_smoking = analyzer.get_smoking_status_analysis(engine, config['federated_node_id'], smoking_codes, save=True)
print("\n===================== ANALYSIS SUMMARY =====================")
print(f"Schema Inspection: {'Passed' if schema_check else 'Failed'}")
print(f"Age Distribution: {len(df_age)} records")
print(f"Summary Statistics: {len(df_summary)} entries")
print(f"Demographics Summary: {len(df_demographics)} records")
print(f"Location Distribution: {len(df_locations)} locations")
print(f"Visit Distribution: {len(df_visits)} types")
print(f"Condition Distribution: {len(df_conditions)} codes")
print(f"Drug Distribution: {len(df_drugs)} records")
print(f"Lung Cancer Conditions: {len(df_lc_conditions)} codes")
print(f"Incident Rates: {len(df_incident)} time points")
print(f"Kaplan–Meier Data: {len(df_km)} rows")
print(f"Smoking Status Analysis: {len(df_smoking)} groups")
print("============================================================")
All analysis outputs (plots, tables, and figures) are saved in the local directory and can be used for further reporting or modeling.
FAQs
Lung cancer risk profiling using time-to-event modeling (LCRPM)
We found that lcrpm demonstrated a healthy version release cadence and project activity because the last version was released less than a year ago. It has 1 open source maintainer collaborating on the project.
Did you know?

Socket for GitHub automatically highlights issues in each pull request and monitors the health of all your open source dependencies. Discover the contents of your packages and block harmful activity before you install or update your dependencies.

Research
/Security News
A flawed sandbox in @nestjs/devtools-integration lets attackers run code on your machine via CSRF, leading to full Remote Code Execution (RCE).

Product
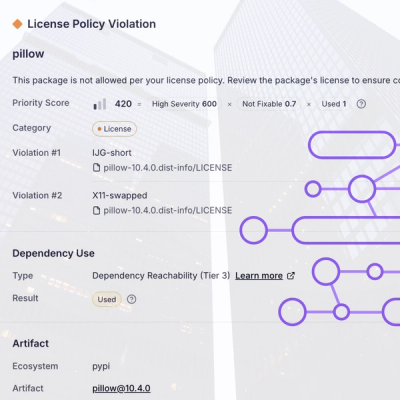
Customize license detection with Socket’s new license overlays: gain control, reduce noise, and handle edge cases with precision.

Product
Socket now supports Rust and Cargo, offering package search for all users and experimental SBOM generation for enterprise projects.