Product
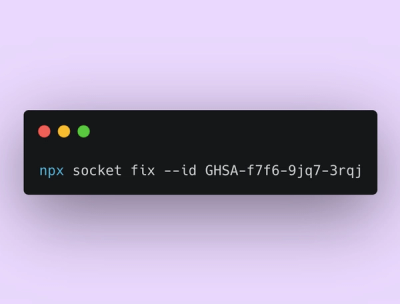
Announcing Socket Fix 2.0
Socket Fix 2.0 brings targeted CVE remediation, smarter upgrade planning, and broader ecosystem support to help developers get to zero alerts.
|Pypi| |ReadTheDocs| |Downloads| |CircleCI| |GithubActions| |Codecov|
This is the official line_profiler repository. The most recent version of
line-profiler <https://pypi.org/project/line_profiler/>_ on pypi points to
this repo.
The original line_profiler <https://github.com/rkern/line_profiler/>_ package
by @rkern <https://github.com/rkern/>_ is unmaintained.
This fork is the official continuation of the project.
+---------------+--------------------------------------------+ | Github | https://github.com/pyutils/line_profiler | +---------------+--------------------------------------------+ | Pypi | https://pypi.org/project/line_profiler | +---------------+--------------------------------------------+ | ReadTheDocs | https://kernprof.readthedocs.io/en/latest/ | +---------------+--------------------------------------------+
line_profiler is a module for doing line-by-line profiling of functions.
kernprof is a convenient script for running either line_profiler or the Python
standard library's cProfile or profile modules, depending on what is available.
They are available under a BSD license_.
.. _BSD license: https://raw.githubusercontent.com/pyutils/line_profiler/master/LICENSE.txt
.. contents::
This guide is for versions of line profiler starting at 4.1.0.
To profile a python script:
Install line_profiler: pip install line_profiler.
In the relevant file(s), import line profiler and decorate function(s) you
want to profile with @line_profiler.profile.
Set the environment variable LINE_PROFILE=1 and run your script as normal.
When the script ends a summary of profile results, files written to disk, and
instructions for inspecting details will be written to stdout.
For more details and a short tutorial see Line Profiler Basic Usage <https://kernprof.readthedocs.io/en/latest/#line-profiler-basic-usage>_.
This section is the original quick-start guide, and may eventually be removed
from the README. This will work with current and older (pre 4.1.0) versions
of line profiler.
To profile a python script:
Install line_profiler: pip install line_profiler.
Decorate function(s) you want to profile with @profile. The decorator will be made automatically available on run.
Run kernprof -lv script_to_profile.py.
Releases of line_profiler can be installed using pip::
$ pip install line_profiler
Installation while ensuring a compatible IPython version can also be installed using pip::
$ pip install line_profiler[ipython]
To check out the development sources, you can use Git_::
$ git clone https://github.com/pyutils/line_profiler.git
You may also download source tarballs of any snapshot from that URL.
Source releases will require a C compiler in order to build line_profiler.
In addition, git checkouts will also require Cython. Source releases
on PyPI should contain the pregenerated C sources, so Cython should not be
required in that case.
kernprof is a single-file pure Python script and does not require
a compiler. If you wish to use it to run cProfile and not line-by-line
profiling, you may copy it to a directory on your PATH manually and avoid
trying to build any C extensions.
As of 2021-06-04 Linux (x86_64 and i686), OSX (10_9_x86_64), and Win32 (win32, and amd64) binaries are available on pypi.
The last version of line profiler to support Python 2.7 was 3.1.0 and the last version to support Python 3.5 was 3.3.1.
.. _git: http://git-scm.com/ .. _Cython: http://www.cython.org .. _build and install: http://docs.python.org/install/index.html
The current profiling tools supported in Python only time function calls. This is a good first step for locating hotspots in one's program and is frequently all one needs to do to optimize the program. However, sometimes the cause of the hotspot is actually a single line in the function, and that line may not be obvious from just reading the source code. These cases are particularly frequent in scientific computing. Functions tend to be larger (sometimes because of legitimate algorithmic complexity, sometimes because the programmer is still trying to write FORTRAN code), and a single statement without function calls can trigger lots of computation when using libraries like numpy. cProfile only times explicit function calls, not special methods called because of syntax. Consequently, a relatively slow numpy operation on large arrays like this, ::
a[large_index_array] = some_other_large_array
is a hotspot that never gets broken out by cProfile because there is no explicit function call in that statement.
LineProfiler can be given functions to profile, and it will time the execution
of each individual line inside those functions. In a typical workflow, one only
cares about line timings of a few functions because wading through the results
of timing every single line of code would be overwhelming. However, LineProfiler
does need to be explicitly told what functions to profile. The easiest way to
get started is to use the kernprof script. ::
$ kernprof -l script_to_profile.py
kernprof will create an instance of LineProfiler and insert it into the
__builtins__ namespace with the name profile. It has been written to be
used as a decorator, so in your script, you decorate the functions you want
to profile with @profile. ::
@profile
def slow_function(a, b, c):
    ...
The default behavior of kernprof is to put the results into a binary file
script_to_profile.py.lprof . You can tell kernprof to immediately view the
formatted results at the terminal with the [-v/--view] option. Otherwise, you
can view the results later like so::
$ python -m line_profiler script_to_profile.py.lprof
For example, here are the results of profiling a single function from
a decorated version of the pystone.py benchmark (the first two lines are output
from pystone.py, not kernprof)::
Pystone(1.1) time for 50000 passes = 2.48
This machine benchmarks at 20161.3 pystones/second
Wrote profile results to pystone.py.lprof
Timer unit: 1e-06 s

File: pystone.py
Function: Proc2 at line 149
Total time: 0.606656 s

Line #      Hits         Time  Per Hit   % Time  Line Contents
==============================================================
   149                                           @profile
   150                                           def Proc2(IntParIO):
   151     50000        82003      1.6     13.5      IntLoc = IntParIO + 10
   152     50000        63162      1.3     10.4      while 1:
   153     50000        69065      1.4     11.4          if Char1Glob == 'A':
   154     50000        66354      1.3     10.9              IntLoc = IntLoc - 1
   155     50000        67263      1.3     11.1              IntParIO = IntLoc - IntGlob
   156     50000        65494      1.3     10.8              EnumLoc = Ident1
   157     50000        68001      1.4     11.2          if EnumLoc == Ident1:
   158     50000        63739      1.3     10.5              break
   159     50000        61575      1.2     10.1      return IntParIO
The source code of the function is printed with the timing information for each line. There are six columns of information.
* Line #: The line number in the file.

* Hits: The number of times that line was executed.

* Time: The total amount of time spent executing the line in the timer's
  units. In the header information before the tables, you will see a line
  "Timer unit:" giving the conversion factor to seconds. It may be different
  on different systems.

* Per Hit: The average amount of time spent executing the line once in the
  timer's units.

* % Time: The percentage of time spent on that line relative to the total
  amount of recorded time spent in the function.

* Line Contents: The actual source code. Note that this is always read from
  disk when the formatted results are viewed, *not* when the code was
  executed. If you have edited the file in the meantime, the lines will not
  match up, and the formatter may not even be able to locate the function
  for display.
If you are using IPython, there is an implementation of an %lprun magic command which will let you specify functions to profile and a statement to execute. It will also add its LineProfiler instance into the builtins, but typically, you would not use it like that.
For IPython 0.11+, you can install it by editing the IPython configuration file
~/.ipython/profile_default/ipython_config.py to add the 'line_profiler'
item to the extensions list::
c.TerminalIPythonApp.extensions = [
    'line_profiler',
]
Or explicitly call::
%load_ext line_profiler
To get usage help for %lprun, use the standard IPython help mechanism::
In [1]: %lprun?
These two methods are expected to be the most frequent user-level ways of using
LineProfiler and will usually be the easiest. However, if you are building other
tools with LineProfiler, you will need to use the API. There are two ways to
inform LineProfiler of functions to profile: you can pass them as arguments to
the constructor or use the add_function(f) method after instantiation. ::
profile = LineProfiler(f, g)
profile.add_function(h)
LineProfiler has the same run(), runctx(), and runcall() methods as
cProfile.Profile as well as enable() and disable(). It should be noted,
though, that enable() and disable() are not entirely safe when nested.
Nesting is common when using LineProfiler as a decorator. In order to support
nesting, use enable_by_count() and disable_by_count(). These functions will
increment and decrement a counter and only actually enable or disable the
profiler when the count transitions from or to 0.
After profiling, the dump_stats(filename) method will pickle the results out
to the given file. print_stats([stream]) will print the formatted results to
sys.stdout or whatever stream you specify. get_stats() will return LineStats
object, which just holds two attributes: a dictionary containing the results and
the timer unit.
kernprof also works with cProfile, its third-party incarnation lsprof, or the
pure-Python profile module depending on what is available. It has a few main
features:
* Encapsulation of profiling concerns. You do not have to modify your script
  in order to initiate profiling and save the results. Unless if you want to
  use the advanced __builtins__ features, of course.

* Robust script execution. Many scripts require things like __name__,
  __file__, and sys.path to be set relative to it. A naive approach at
  encapsulation would just use execfile(), but many scripts which rely on
  that information will fail. kernprof will set those variables correctly
  before executing the script.

* Easy executable location. If you are profiling an application installed on
  your PATH, you can just give the name of the executable. If kernprof does
  not find the given script in the current directory, it will search your
  PATH for it.

* Inserting the profiler into __builtins__. Sometimes, you just want to
  profile a small part of your code. With the [-b/--builtin] argument, the
  Profiler will be instantiated and inserted into your __builtins__ with the
  name "profile". Like LineProfiler, it may be used as a decorator, or
  enabled/disabled with ``enable_by_count()`` and ``disable_by_count()``, or
  even as a context manager with the "with profile:" statement.

* Pre-profiling setup. With the [-s/--setup] option, you can provide
  a script which will be executed without profiling before executing the
  main script. This is typically useful for cases where imports of large
  libraries like wxPython or VTK are interfering with your results. If you
  can modify your source code, the __builtins__ approach may be
  easier.
The results of profile script_to_profile.py will be written to script_to_profile.py.prof by default. It will be a typical marshalled file that can be read with pstats.Stats(). They may be interactively viewed with the command::
$ python -m pstats script_to_profile.py.prof
Such files may also be viewed with graphical tools. A list of 3rd party tools
built on cProfile or line_profiler are as follows:
pyprof2calltree <pyprof2calltree_>: converts profiling data to a format
that can be visualized using kcachegrind (linux only), wincachegrind_
(windows only, unmaintained), or qcachegrind_.
Line Profiler GUI <qt_profiler_gui_>_: Qt GUI for line_profiler.
SnakeViz <SnakeViz_>_: A web viewer for Python profiling data.
SnakeRunner <SnakeRunner_>: A fork of RunSnakeRun, ported to Python 3.
Pycharm plugin <pycharm_line_profiler_plugin_>_: A PyCharm plugin for line_profiler.
Spyder plugin <spyder_line_profiler_plugin_>_: A plugin to run line_profiler from within the Spyder IDE.
pprof <web_profiler_ui_>_: A render web report for line_profiler.
.. _qcachegrind: https://sourceforge.net/projects/qcachegrindwin/ .. _kcachegrind: https://kcachegrind.github.io/html/Home.html .. _wincachegrind: https://github.com/ceefour/wincachegrind .. _pyprof2calltree: http://pypi.python.org/pypi/pyprof2calltree/ .. _SnakeViz: https://github.com/jiffyclub/snakeviz/ .. _SnakeRunner: https://github.com/venthur/snakerunner .. _RunSnakeRun: https://pypi.org/project/RunSnakeRun/ .. _qt_profiler_gui: https://github.com/Nodd/lineprofilergui .. _pycharm_line_profiler_plugin: https://plugins.jetbrains.com/plugin/16536-line-profiler .. _spyder_line_profiler_plugin: https://github.com/spyder-ide/spyder-line-profiler .. _web_profiler_ui: https://github.com/mirecl/pprof
Check out these other Python profilers:
Scalene <https://github.com/plasma-umass/scalene>_: A CPU+GPU+memory sampling based profiler.
PyInstrument <https://github.com/joerick/pyinstrument>_: A call stack profiler.
Yappi <https://github.com/sumerc/yappi>_: A tracing profiler that is multithreading, asyncio and gevent aware.
profile / cProfile <https://docs.python.org/3/library/profile.html>_: The builtin profile module.
timeit <https://docs.python.org/3/library/timeit.html>_: The builtin timeit module for profiling single statements.
timerit <https://github.com/Erotemic/timerit>_: A multi-statements alternative to the builtin timeit module.
Why the name "kernprof"?
I didn't manage to come up with a meaningful name, so I named it after myself.
The line-by-line timings don't add up when one profiled function calls another. What's up with that?
Let's say you have function F() calling function G(), and you are using LineProfiler on both. The total time reported for G() is less than the time reported on the line in F() that calls G(). The reason is that I'm being reasonably clever (and possibly too clever) in recording the times. Basically, I try to prevent recording the time spent inside LineProfiler doing all of the bookkeeping for each line. Each time Python's tracing facility issues a line event (which happens just before a line actually gets executed), LineProfiler will find two timestamps, one at the beginning before it does anything (t_begin) and one as close to the end as possible (t_end). Almost all of the overhead of LineProfiler's data structures happens in between these two times.
When a line event comes in, LineProfiler finds the function it belongs to. If it's the first line in the function, we record the line number and t_end associated with the function. The next time we see a line event belonging to that function, we take t_begin of the new event and subtract the old t_end from it to find the amount of time spent in the old line. Then we record the new t_end as the active line for this function. This way, we are removing most of LineProfiler's overhead from the results. Well almost. When one profiled function F calls another profiled function G, the line in F that calls G basically records the total time spent executing the line, which includes the time spent inside the profiler while inside G.
The first time this question was asked, the questioner had the G() function call as part of a larger expression, and he wanted to try to estimate how much time was being spent in the function as opposed to the rest of the expression. My response was that, even if I could remove the effect, it might still be misleading. G() might be called elsewhere, not just from the relevant line in F(). The workaround would be to modify the code to split it up into two lines, one which just assigns the result of G() to a temporary variable and the other with the rest of the expression.
I am open to suggestions on how to make this more robust. Or simple admonitions against trying to be clever.
Why do my list comprehensions have so many hits when I use the LineProfiler?
LineProfiler records the line with the list comprehension once for each iteration of the list comprehension.
Why is kernprof distributed with line_profiler? It works with just cProfile, right?
Partly because kernprof.py is essential to using line_profiler effectively,
but mostly because I'm lazy and don't want to maintain the overhead of two
projects for modules as small as these. However, kernprof.py is
a standalone, pure Python script that can be used to do function profiling
with just the Python standard library. You may grab it and install it by
itself without line_profiler.
Do I need a C compiler to build line_profiler? kernprof.py?
You do need a C compiler for line_profiler. kernprof.py is a pure Python script and can be installed separately, though.
Do I need Cython to build line_profiler?
Wheels for supported versions of Python are available on PyPI and support linux, osx, and windows for x86-64 architectures. Linux additionally ships with i686 wheels for manylinux and musllinux. If you have a different CPU architecture, or an unsupported Python version, then you will need to build from source.
What version of Python do I need?
Both line_profiler and kernprof have been tested with Python 3.6-3.11.
Older versions of line_profiler support older versions of Python.
cProfile uses a neat "rotating trees" data structure to minimize the overhead of looking up and recording entries. LineProfiler uses Python dictionaries and extension objects thanks to Cython. This mostly started out as a prototype that I wanted to play with as quickly as possible, so I passed on stealing the rotating trees for now. As usual, I got it working, and it seems to have acceptable performance, so I am much less motivated to use a different strategy now. Maybe later. Contributions accepted!
Bugs and pull requested can be submitted on GitHub_.
.. _GitHub: https://github.com/pyutils/line_profiler
See CHANGELOG_.
.. _CHANGELOG: CHANGELOG.rst
.. |CircleCI| image:: https://circleci.com/gh/pyutils/line_profiler.svg?style=svg :target: https://circleci.com/gh/pyutils/line_profiler .. |Travis| image:: https://img.shields.io/travis/pyutils/line_profiler/master.svg?label=Travis%20CI :target: https://travis-ci.org/pyutils/line_profiler?branch=master .. |Appveyor| image:: https://ci.appveyor.com/api/projects/status/github/pyutils/line_profiler?branch=master&svg=True :target: https://ci.appveyor.com/project/pyutils/line_profiler/branch/master .. |Codecov| image:: https://codecov.io/github/pyutils/line_profiler/badge.svg?branch=master&service=github :target: https://codecov.io/github/pyutils/line_profiler?branch=master .. |Pypi| image:: https://img.shields.io/pypi/v/line_profiler.svg :target: https://pypi.python.org/pypi/line_profiler .. |Downloads| image:: https://img.shields.io/pypi/dm/line_profiler.svg :target: https://pypistats.org/packages/line-profiler .. |GithubActions| image:: https://github.com/pyutils/line_profiler/actions/workflows/tests.yml/badge.svg?branch=main :target: https://github.com/pyutils/line_profiler/actions?query=branch%3Amain .. |ReadTheDocs| image:: https://readthedocs.org/projects/kernprof/badge/?version=latest :target: http://kernprof.readthedocs.io/en/latest/
FAQs
Line-by-line profiler
We found that line-profiler demonstrated a healthy version release cadence and project activity because the last version was released less than a year ago. It has 4 open source maintainers collaborating on the project.
Did you know?

Socket for GitHub automatically highlights issues in each pull request and monitors the health of all your open source dependencies. Discover the contents of your packages and block harmful activity before you install or update your dependencies.

Product
Socket Fix 2.0 brings targeted CVE remediation, smarter upgrade planning, and broader ecosystem support to help developers get to zero alerts.

Security News
Socket CEO Feross Aboukhadijeh joins Risky Business Weekly to unpack recent npm phishing attacks, their limited impact, and the risks if attackers get smarter.

Product
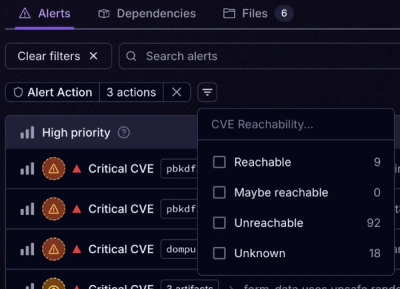
Socket’s new Tier 1 Reachability filters out up to 80% of irrelevant CVEs, so security teams can focus on the vulnerabilities that matter.