Product
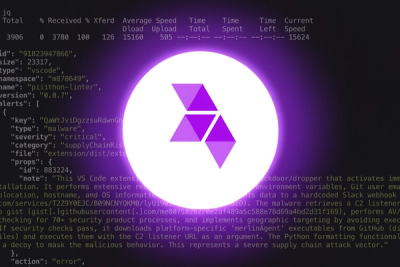
Introducing Socket Scanning for OpenVSX Extensions
Socket now scans OpenVSX extensions, giving teams early detection of risky behaviors, hidden capabilities, and supply chain threats in developer tools.
mars-profiling
Advanced tools

Documentation | Slack | Stack Overflow
Generates profile reports from a pandas DataFrame.
The pandas df.describe() function is great but a little basic for serious exploratory data analysis.
pandas_profiling extends the pandas DataFrame with df.profile_report() for quick data analysis.
For each column the following statistics - if relevant for the column type - are presented in an interactive HTML report:
The release candidate for v2.9.0 was already out for a while, now v2.9.0 is finally released. See the changelog below to know what has changed.
We can happily announce that we're working on a Spark backend for generating profile reports. Stay tuned.
pandas-profilingThe development of pandas-profiling relies completely on contributions.
If you find value in the package, we welcome you to support the project through GitHub Sponsors!
It's extra exciting that GitHub matches your contribution for the first year.
Find more information here:
September 2, 2020 💘
Contents: Examples | Installation | Documentation | Large datasets | Command line usage | Advanced usage | Support | Types | How to contribute | Editor Integration | Dependencies
The following examples can give you an impression of what the package can do:
Specific features:
Tutorials:
You can install using the pip package manager by running
pip install pandas-profiling[notebook]
Alternatively, you could install the latest version directly from Github:
pip install https://github.com/pandas-profiling/pandas-profiling/archive/master.zip
You can install using the conda package manager by running
conda install -c conda-forge pandas-profiling
Download the source code by cloning the repository or by pressing 'Download ZIP' on this page.
Install by navigating to the proper directory and running:
python setup.py install
The documentation for pandas_profiling can be found here. Previous documentation is still available here.
Start by loading in your pandas DataFrame, e.g. by using:
import numpy as np
import pandas as pd
from mars_profiling import ProfileReport

df = pd.DataFrame(
    np.random.rand(100, 5),
    columns=["a", "b", "c", "d", "e"]
)
To generate the report, run:
profile = ProfileReport(df, title="Pandas Profiling Report")
You can configure the profile report in any way you like. The example code below loads the explorative configuration file, that includes many features for text (length distribution, unicode information), files (file size, creation time) and images (dimensions, exif information). If you are interested what exact settings were used, you can compare with the default configuration file.
profile = ProfileReport(df, title='Pandas Profiling Report', explorative=True)
Learn more about configuring pandas-profiling on the Advanced usage page.
We recommend generating reports interactively by using the Jupyter notebook. There are two interfaces (see animations below): through widgets and through a HTML report.

This is achieved by simply displaying the report. In the Jupyter Notebook, run:
profile.to_widgets()
The HTML report can be included in a Jupyter notebook:

Run the following code:
profile.to_notebook_iframe()
If you want to generate a HTML report file, save the ProfileReport to an object and use the to_file() function:
profile.to_file("your_report.html")
Alternatively, you can obtain the data as JSON:
# As a string
json_data = profile.to_json()

# As a file
profile.to_file("your_report.json")
Version 2.4 introduces minimal mode.
This is a default configuration that disables expensive computations (such as correlations and dynamic binning).
Use the following syntax:
profile = ProfileReport(large_dataset, minimal=True)
profile.to_file("output.html")
For standard formatted CSV files that can be read immediately by pandas, you can use the pandas_profiling executable.
Run the following for information about options and arguments.
mars_profiling -h
A set of options is available in order to adapt the report generated.
title (str): Title for the report ('Pandas Profiling Report' by default).pool_size (int): Number of workers in thread pool. When set to zero, it is set to the number of CPUs available (0 by default).progress_bar (bool): If True, pandas-profiling will display a progress bar.More settings can be found in the default configuration file, minimal configuration file and dark themed configuration file.
Example
profile = df.profile_report(title='Pandas Profiling Report', plot={'histogram': {'bins': 8}})
profile.to_file("output.html")
Maintaining and developing the open-source code for pandas-profiling, with millions of downloads and thousands of users, would not be possible with support of our gracious sponsors.

|
Lambda workstations, servers, laptops, and cloud services power engineers and researchers at Fortune 500 companies and 94% of the top 50 universities. Lambda Cloud offers 4 & 8 GPU instances starting at $1.50 / hr. Pre-installed with TensorFlow, PyTorch, Ubuntu, CUDA, and cuDNN. |
We would like to thank our generous Github Sponsors supporters who make pandas-profiling possible:
Martin Sotir, Joseph Yuen, Brian Lee, Stephanie Rivera, nscsekhar, abdulAziz
More info if you would like to appear here: Github Sponsor page
Types are a powerful abstraction for effective data analysis, that goes beyond the logical data types (integer, float etc.).
pandas-profiling currently recognizes the following types: Boolean, Numerical, Date, Categorical, URL, Path, File and Image.
We have developed a type system for Python, tailored for data analysis: visions.
Selecting the right typeset drastically reduces the complexity the code of your analysis.
Future versions of pandas-profiling will have extended type support through visions!
Read on getting involved in the Contribution Guide.
A low threshold place to ask questions or start contributing is by reaching out on the pandas-profiling Slack. Join the Slack community.
pandas-profiling via the instructions abovepandas-profiling executable.
$ which mars_profiling
(example) /usr/local/bin/mars_profiling
$ where pandas_profiling
(example) C:\ProgramData\Anaconda3\Scripts\pandas_profiling.exe
"$FilePath$" "$FileDir$/$FileNameWithoutAllExtensions$_report.html"$ProjectFileDir$
To use the PyCharm Integration, right click on any dataset file:
External Tools > Pandas Profiling.
Other editor integrations may be contributed via pull requests.
The profile report is written in HTML and CSS, which means pandas-profiling requires a modern browser.
You need Python 3 to run this package. Other dependencies can be found in the requirements files:
| Filename | Requirements |
|---|---|
| requirements.txt | Package requirements |
| requirements-dev.txt | Requirements for development |
| requirements-test.txt | Requirements for testing |
| setup.py | Requirements for Widgets etc. |
FAQs
Generate profile report for Mars DataFrame
We found that mars-profiling demonstrated a healthy version release cadence and project activity because the last version was released less than a year ago. It has 1 open source maintainer collaborating on the project.
Did you know?

Socket for GitHub automatically highlights issues in each pull request and monitors the health of all your open source dependencies. Discover the contents of your packages and block harmful activity before you install or update your dependencies.

Product
Socket now scans OpenVSX extensions, giving teams early detection of risky behaviors, hidden capabilities, and supply chain threats in developer tools.

Product
Bringing supply chain security to the next generation of JavaScript package managers

Product
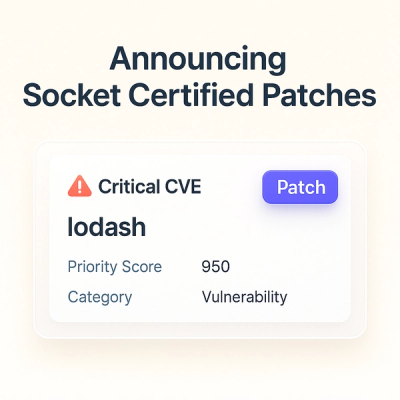
A safer, faster way to eliminate vulnerabilities without updating dependencies