Product
Introducing Rust Support in Socket
Socket now supports Rust and Cargo, offering package search for all users and experimental SBOM generation for enterprise projects.
Create classic technical analysis stock charts in Python with minimal code.
The library is built around matplotlib
and pandas.
Charts can be defined using a declarative interface,
based on a set of drawing primitives like Candleststicks, Volume
and technical indicators like SMA, EMA, RSI, ROC, MACD, etc ...
Warning This project is experimental and the interface can change. For a similar project with a mature api you may want to look into mplfinance.
# Candlesticks chart with SMA, RSI and MACD indicators

import yfinance as yf

from mplchart.chart import Chart
from mplchart.primitives import Candlesticks, Volume
from mplchart.indicators import SMA, EMA, ROC, RSI, MACD

ticker = 'AAPL'
prices = yf.Ticker(ticker).history('5y')

max_bars = 250

indicators = [
    Candlesticks(),
    Volume(),
    SMA(50),
    SMA(200),
    RSI(),
    MACD(),
]

chart = Chart(title=ticker, max_bars=max_bars)
chart.plot(prices, indicators)
chart.show()
Prices data is expected to be presented as a pandas DataFrame
with columns open, high, low, close volume
and a datetime index named date or datetime.
Even though the chart object automatically converts price column names to lower case before calling any indicator, if you intend on using indicators independently from the chart object, you must use prices dataframes with all lower case column names!
The library contains drawing primitives that can be used like an indicator in the plot api. Primitives are classes and must be instantiated as objects before being used with the plot api.
# Candlesticks chart

from mplchart.chart import Chart
from mplchart.primitives import Candlesticks

indicators = [Candlesticks()]
chart = Chart(title=title, max_bars=max_bars)
chart.plot(prices, indicators)
The main drawing primitives are :
Candlesticks for candlestick plotsOHLC for open, high, low, close bar plotsPrice for price line plotsVolume for volume bar plotsPeaks to mark peaks and valleysSameAxes to use same axes as last plotNewAxes to use new axes above or belowLinePlot draw an indicator as line plotAreaPlot draw an indicator as area plotBarPlot draw an indicator as bar plotZigZag lines between pivot pointsThe libary includes some standard technical analysis indicators implemented in pandas/numpy. Indicators are classes and must be instantiated as objects before being used with the plot api.
Some of the indicators included are:
SMA Simple Moving AverageEMA Exponential Moving AverageWMA Weighted Moving AverageHMA Hull Moving AverageROC Rate of ChangeRSI Relative Strength IndexATR Average True RangeATRP Average True Range PercentADX Average Directional IndexDMI Directional Movement IndexMACD Moving Average Convergence DivergencePPO Price Percentage OscillatorCCI Commodity Channel IndexBOP Balance of PowerCMF Chaikin Money FlowMFI Money Flow IndexSLOPE Slope (linear regression)STOCH Stochastic OscillatorBBANDS Bollinger BandsKELTNER Keltner ChannelIf you have ta-lib installed you can use the library abstract functions as indicators.
The indicators are created by calling Function with the name of the indicator and its parameters.
# Candlesticks chart with talib indicators

from mplchart.primitives import Candlesticks
from talib.abstract import Function

indicators = [
    Candlesticks(),
    Function('SMA', 50),
    Function('SMA', 200),
    Function('RSI'),
    Function('MACD'),
]
Most indicators are drawn as line plots with default colors and settings. You can override the rendering of an indicator by piping it with the | operator into a primitive like LinePlot, AreaPlot or BarPlot as in the example below. If the indicator returns a dataframe instead of a series you need to specify an item (column name) in the primitive.
# Customizing indicator style with LinePlot

from mplchart.indicators import SMA, EMA, ROC
from mplchart.primitives import Candlesticks, LinePlot

indicators = [
    Candlesticks(),
    SMA(20) | LinePlot(style="dashed", color="red", alpha=0.5, width=3)
]
NewAxes and SameAxes primitivesIndicators usually plot in a new axes below, except for a few indicators that plot by default in the main axes. You can change the target axes for any indicator by piping it into an axes primitive as in the example below.
# Plotting two indicators on the same axes with SameAxes primitive

from mplchart.indicators import SMA, EMA, ROC
from mplchart.primitives import Candlesticks, SameAxes

indicators = [
    Candlesticks(),
    ROC(20),
    ROC(50) | SameAxes(),
]
Any callable that accepts a prices dataframe and returns a series or dataframe can be used as an indicator.
You can also implement a custom indicator as a subclass of Indicator.
# Custom Indicator Example

from mplchart.model import Indicator
from mplchart.library import calc_ema

class DEMA(Indicator):
    """Double Exponential Moving Average"""

    same_scale = True
    # same_scale is an optional class attribute
    # to specify that the indicator can be drawn
    # on the same axes as the prices

    def __init__(self, period: int = 20):
        self.period = period

    def __call__(self, prices):
        series = self.get_series(prices)
        ema1 = calc_ema(series, self.period)
        ema2 = calc_ema(ema1, self.period)
        return 2 * ema1 - ema2
You can find example notebooks and scripts in the examples folder.
You can install this package with pip
pip install mplchart
FAQs
Classic Stock Charts in Python
We found that mplchart demonstrated a healthy version release cadence and project activity because the last version was released less than a year ago. It has 1 open source maintainer collaborating on the project.
Did you know?

Socket for GitHub automatically highlights issues in each pull request and monitors the health of all your open source dependencies. Discover the contents of your packages and block harmful activity before you install or update your dependencies.

Product
Socket now supports Rust and Cargo, offering package search for all users and experimental SBOM generation for enterprise projects.

Product
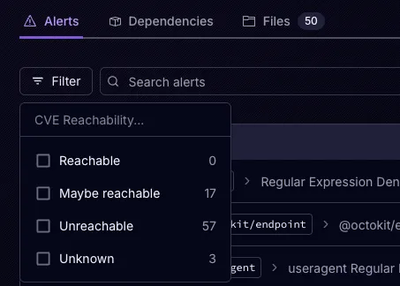
Socket’s precomputed reachability slashes false positives by flagging up to 80% of vulnerabilities as irrelevant, with no setup and instant results.

Product
Socket is launching experimental protection for Chrome extensions, scanning for malware and risky permissions to prevent silent supply chain attacks.