Product
Introducing Enhanced Alert Actions and Triage Functionality
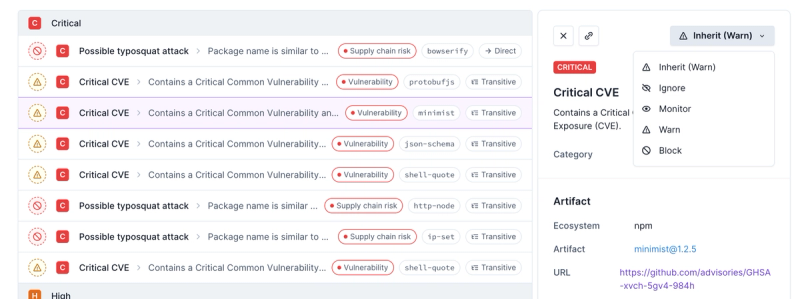
Socket now supports four distinct alert actions instead of the previous two, and alert triaging allows users to override the actions taken for all individual alerts.
By Philipp Burckhardt, Alex Morais - Jun 27, 2024