phyTreeViz


Table of contents
Overview
phyTreeViz is a simple and minimal phylogenetic tree visualization python package implemented based on matplotlib.
This package was developed to enhance phylogenetic tree visualization functionality of BioPython.
phyTreeViz is intended to provide a simple and easy-to-use phylogenetic tree visualization function without complexity.
Therefore, if you need complex tree annotations, I recommend using ete or ggtree.
Installation
Python 3.8 or later is required for installation.
Install PyPI package:
pip install phytreeviz
API Usage
Only simple example usage is described in this section.
For more details, please see Getting Started and API Docs.
API Example
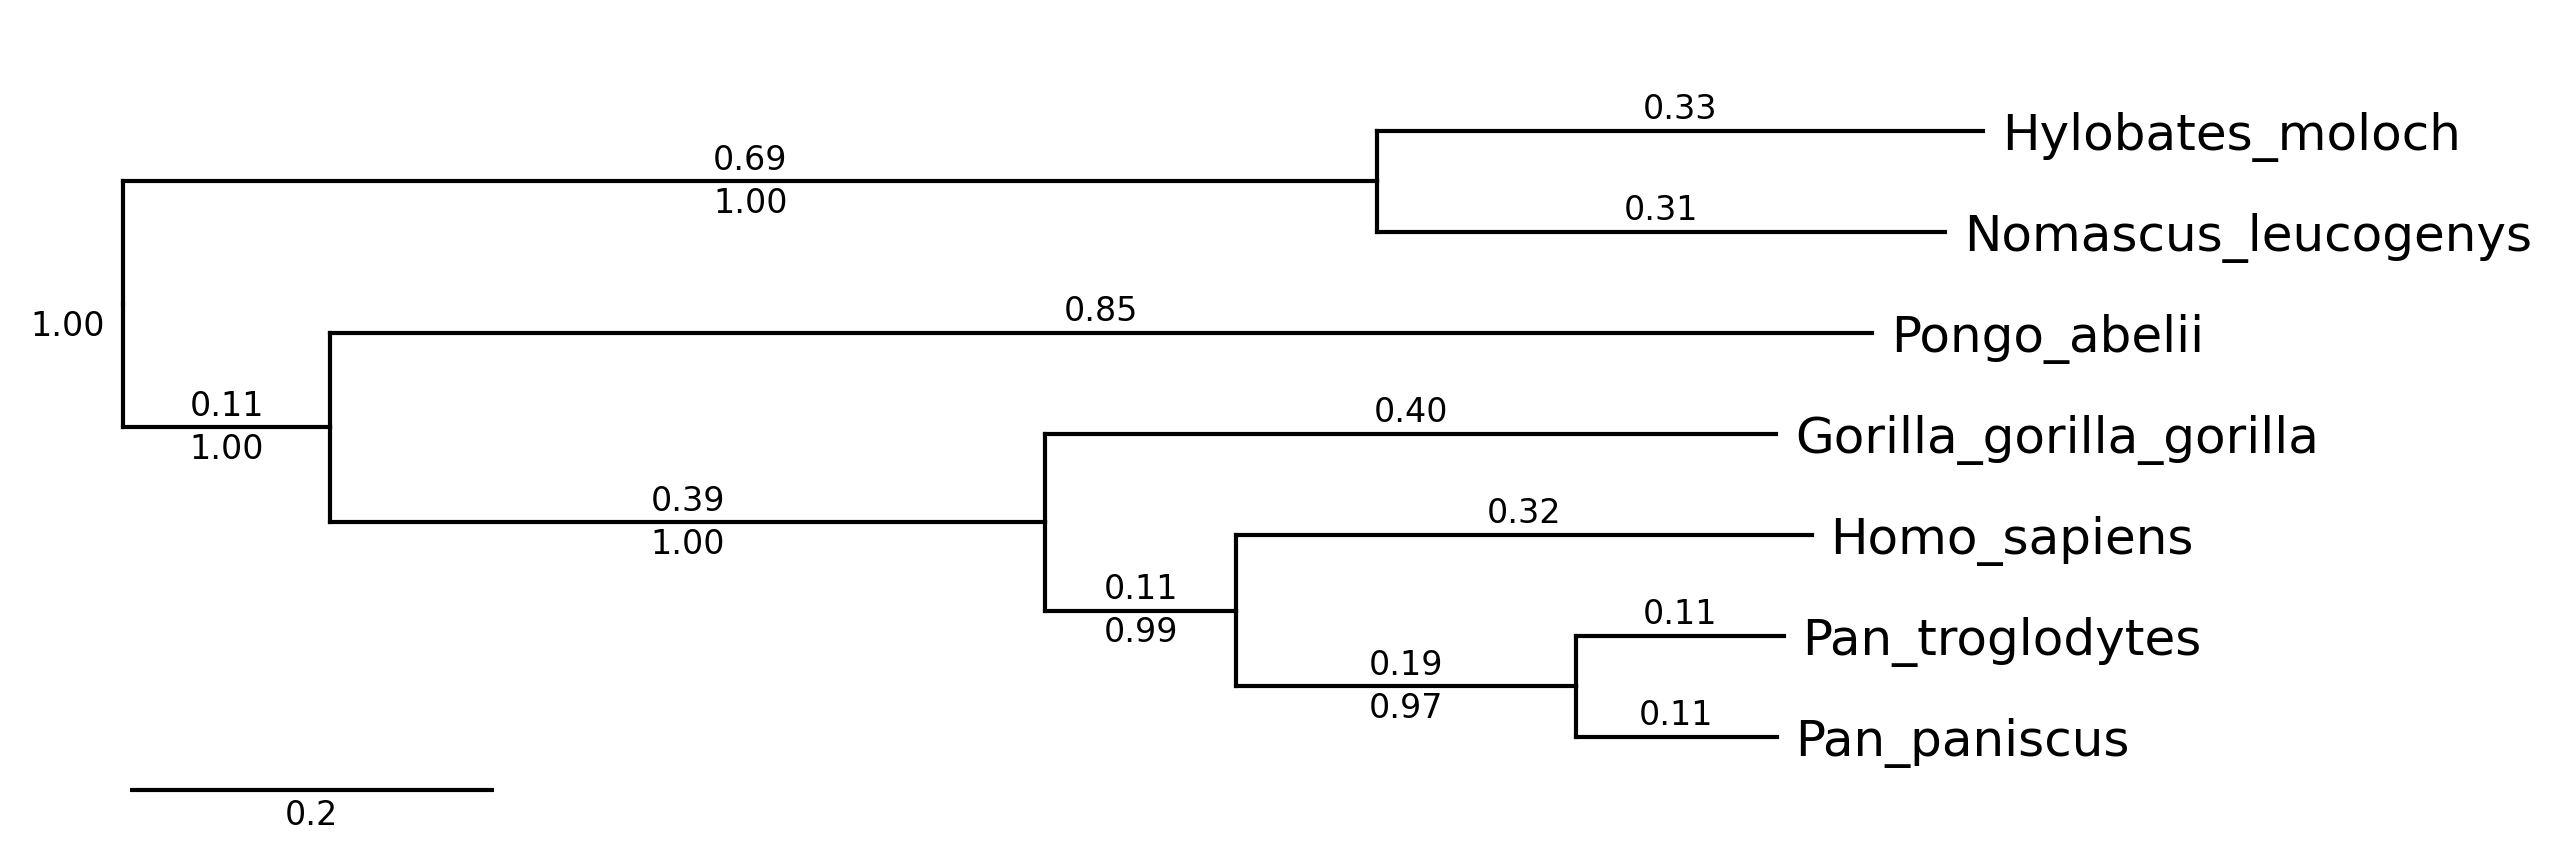
API Example 1
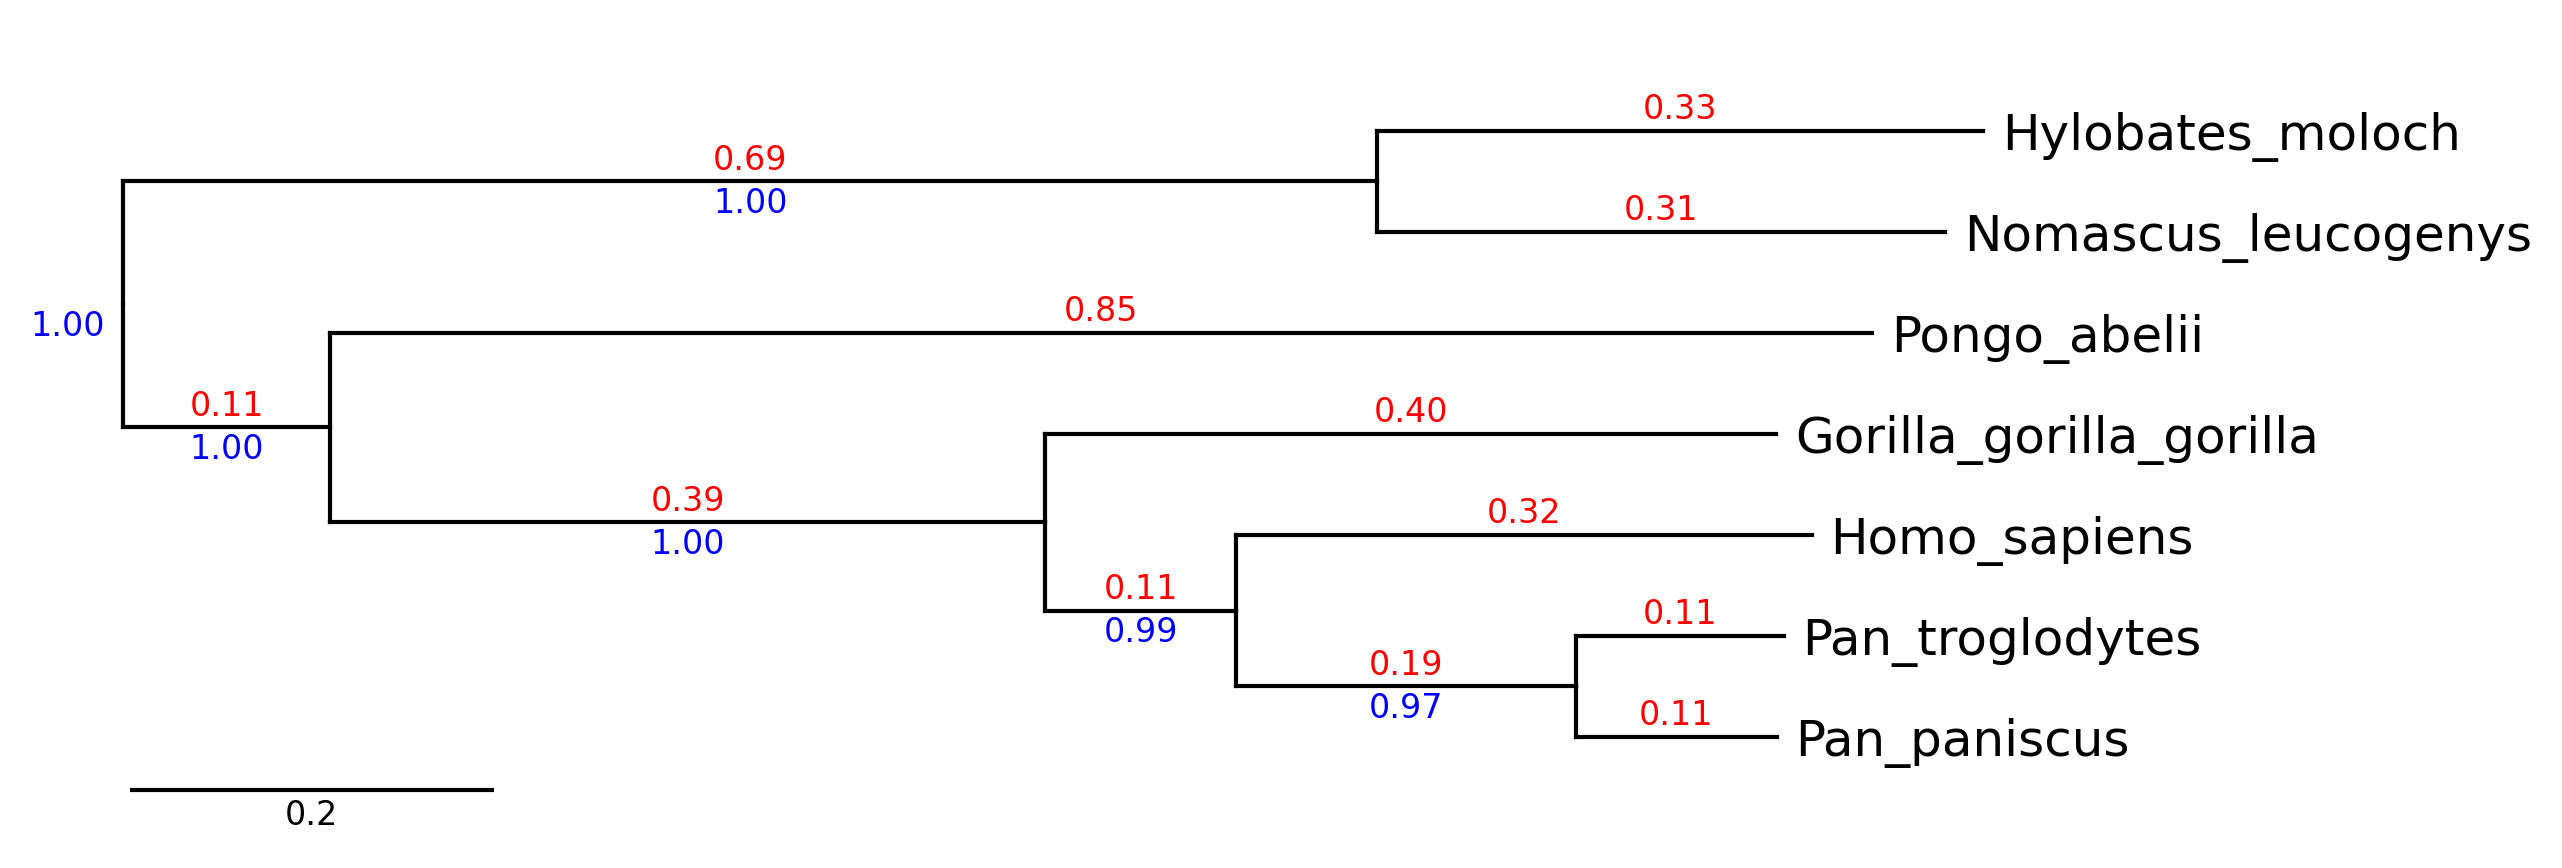
from phytreeviz import TreeViz, load_example_tree_file

tree_file = load_example_tree_file("small_example.nwk")

tv = TreeViz(tree_file)
tv.show_branch_length(color="red")
tv.show_confidence(color="blue")
tv.show_scale_bar()

tv.savefig("api_example01.png", dpi=300)
API Example 2
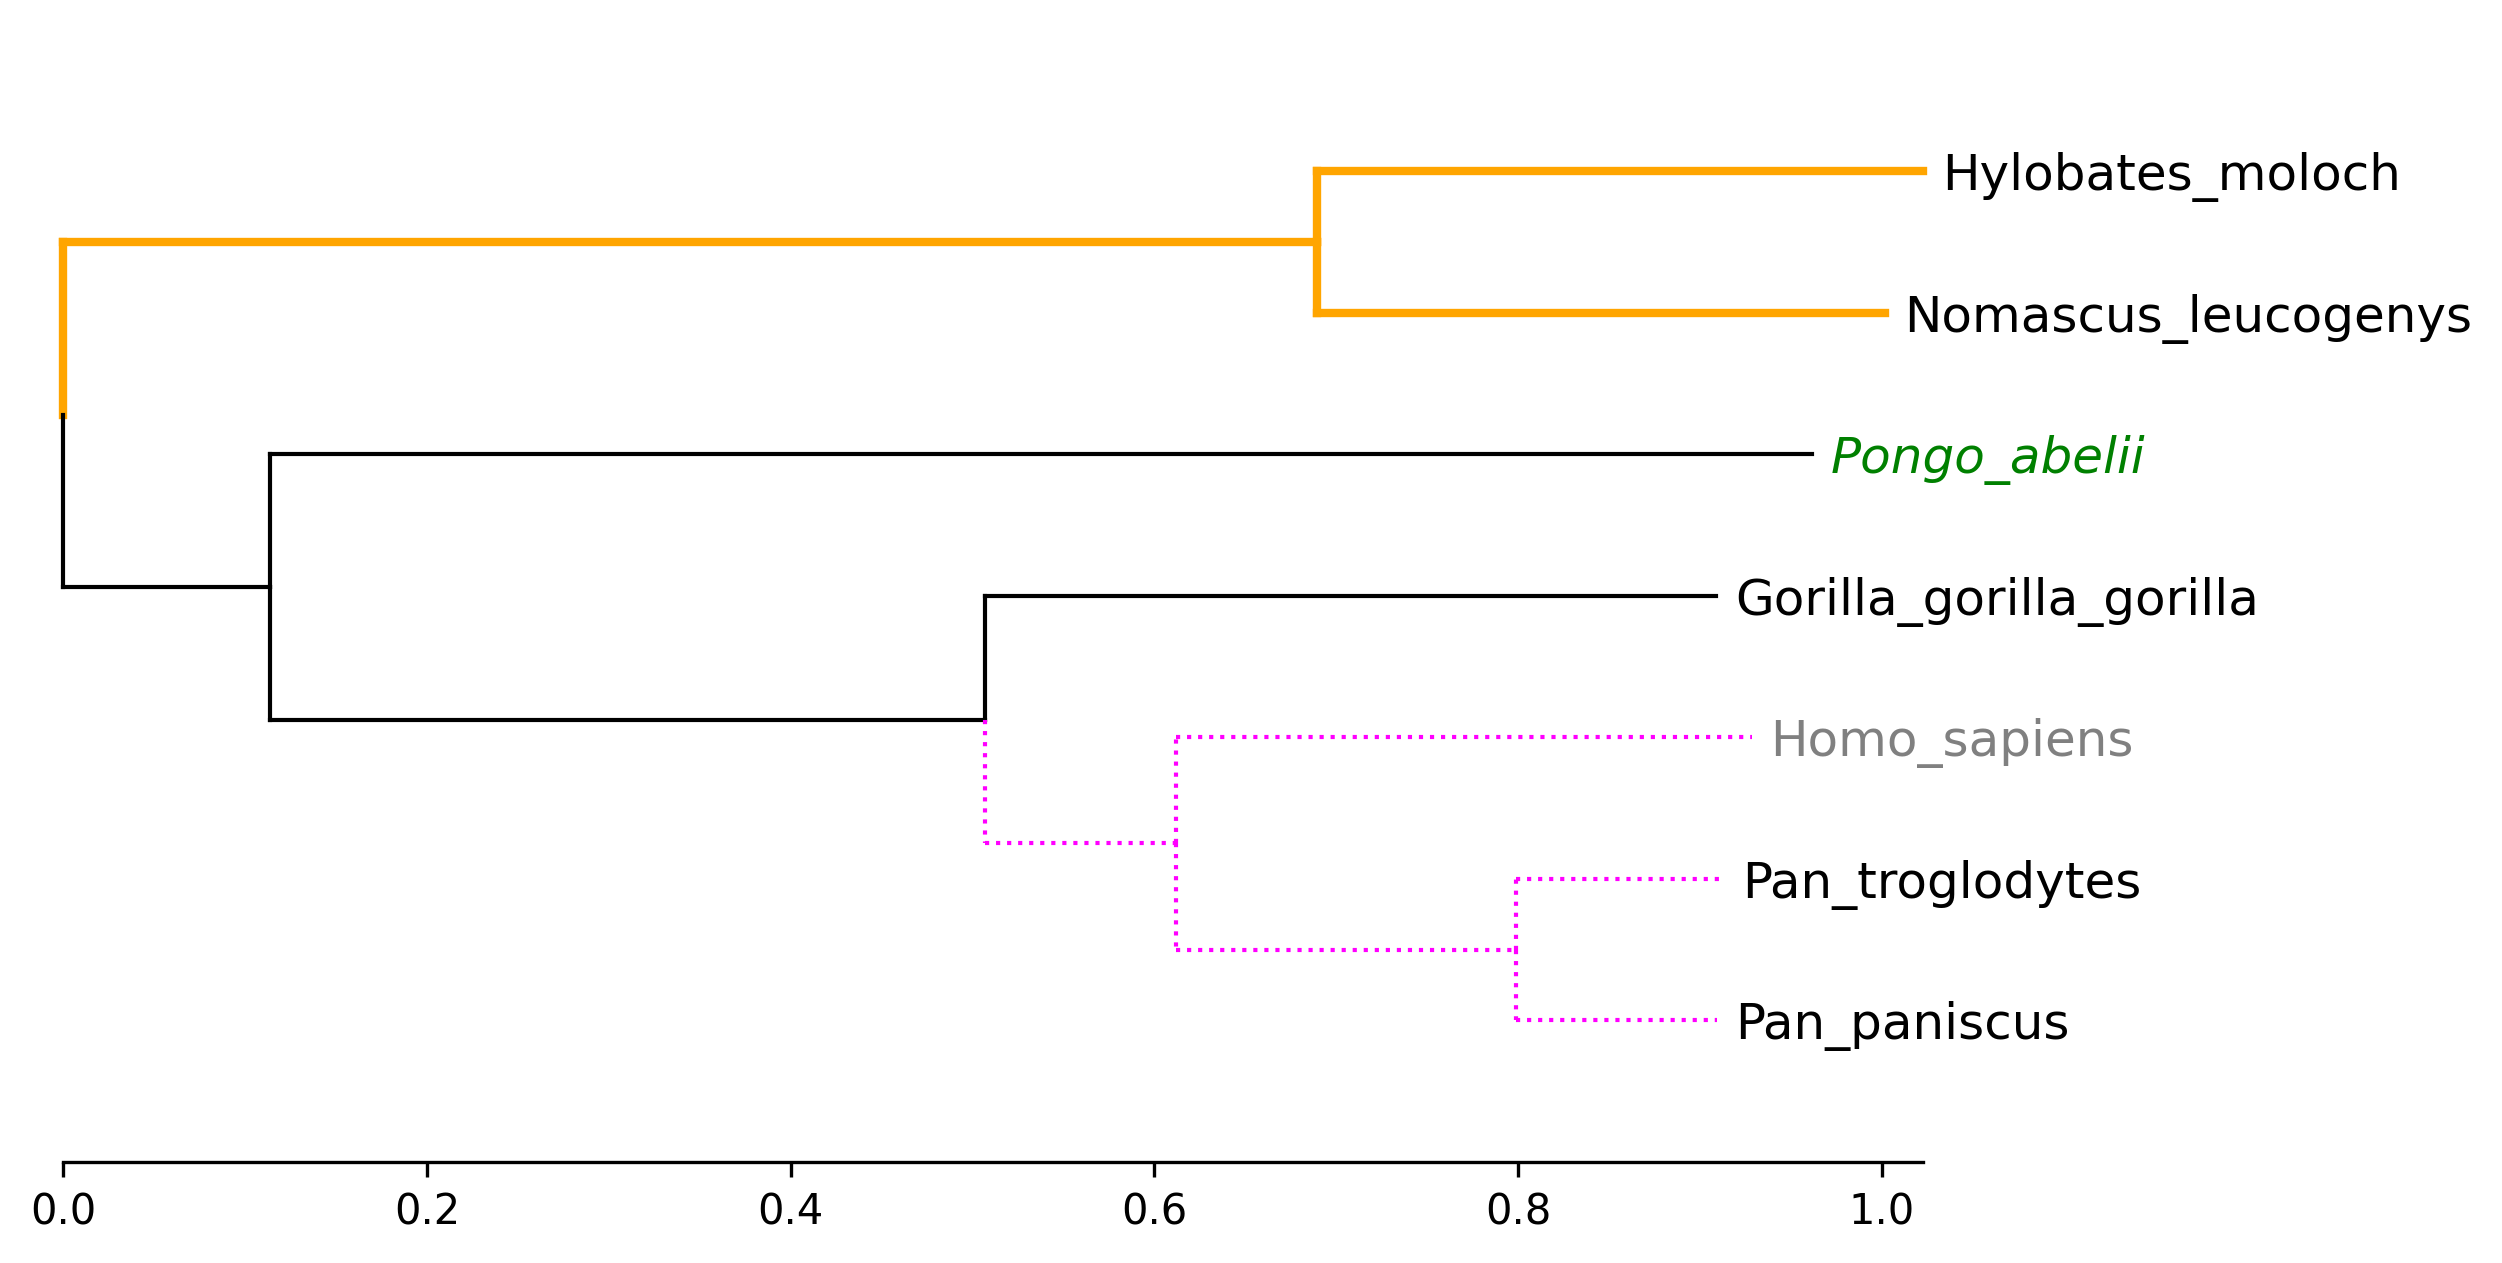
from phytreeviz import TreeViz, load_example_tree_file

tree_file = load_example_tree_file("small_example.nwk")

tv = TreeViz(tree_file, height=0.7)
tv.show_scale_axis()

tv.set_node_label_props("Homo_sapiens", color="grey")
tv.set_node_label_props("Pongo_abelii", color="green", style="italic")

tv.set_node_line_props(["Hylobates_moloch", "Nomascus_leucogenys"], color="orange", lw=2)
tv.set_node_line_props(["Homo_sapiens", "Pan_troglodytes", "Pan_paniscus"], color="magenta", ls="dotted")

tv.savefig("api_example02.png", dpi=300)
API Example 3
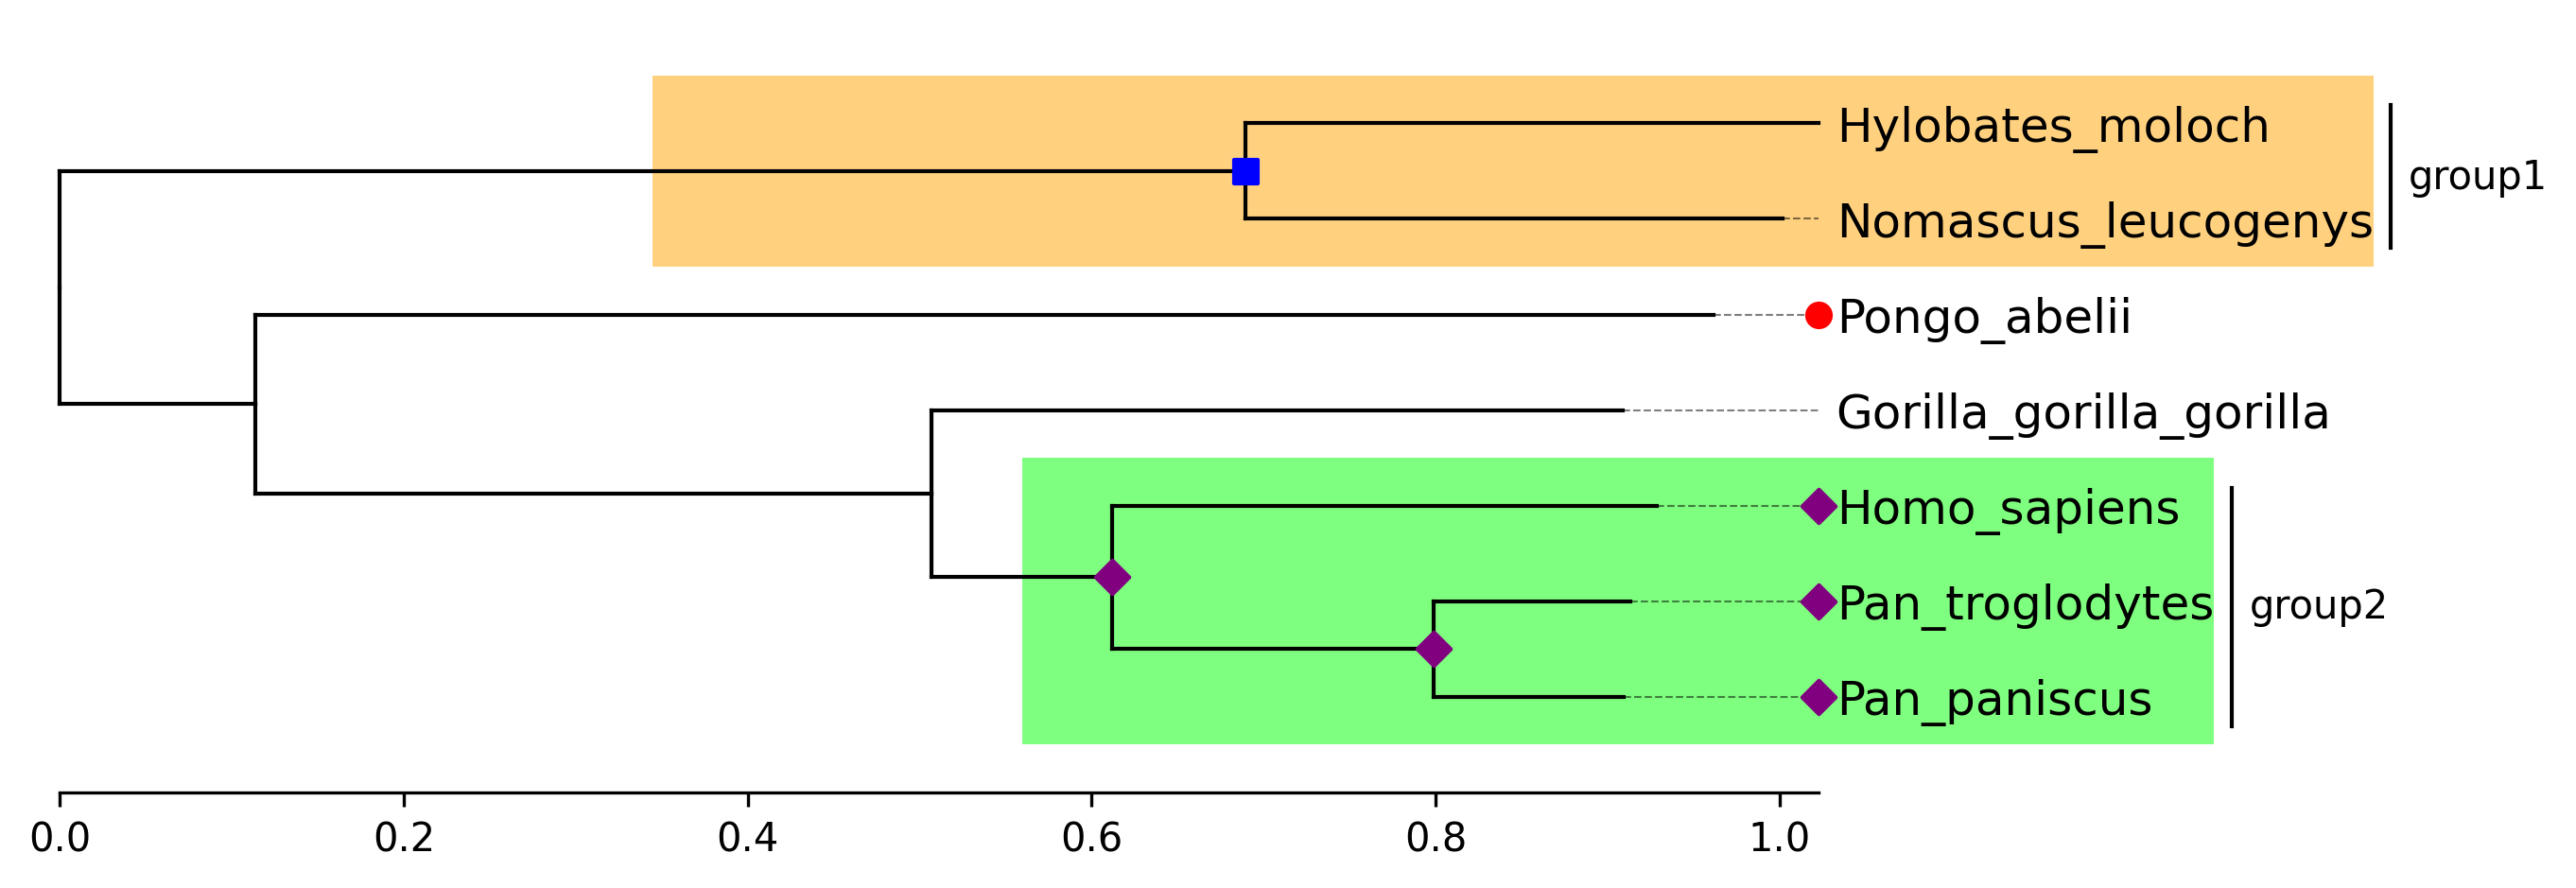
from phytreeviz import TreeViz, load_example_tree_file

tree_file = load_example_tree_file("small_example.nwk")

tv = TreeViz(tree_file, align_leaf_label=True)
tv.show_scale_axis()

group1 = ["Hylobates_moloch", "Nomascus_leucogenys"]
group2 = ["Homo_sapiens", "Pan_paniscus"]

tv.highlight(group1, "orange")
tv.highlight(group2, "lime")

tv.annotate(group1, "group1")
tv.annotate(group2, "group2")

tv.marker(group1, marker="s", color="blue")
tv.marker(group2, marker="D", color="purple", descendent=True)
tv.marker("Pongo_abelii", color="red")

tv.savefig("api_example03.png", dpi=300)
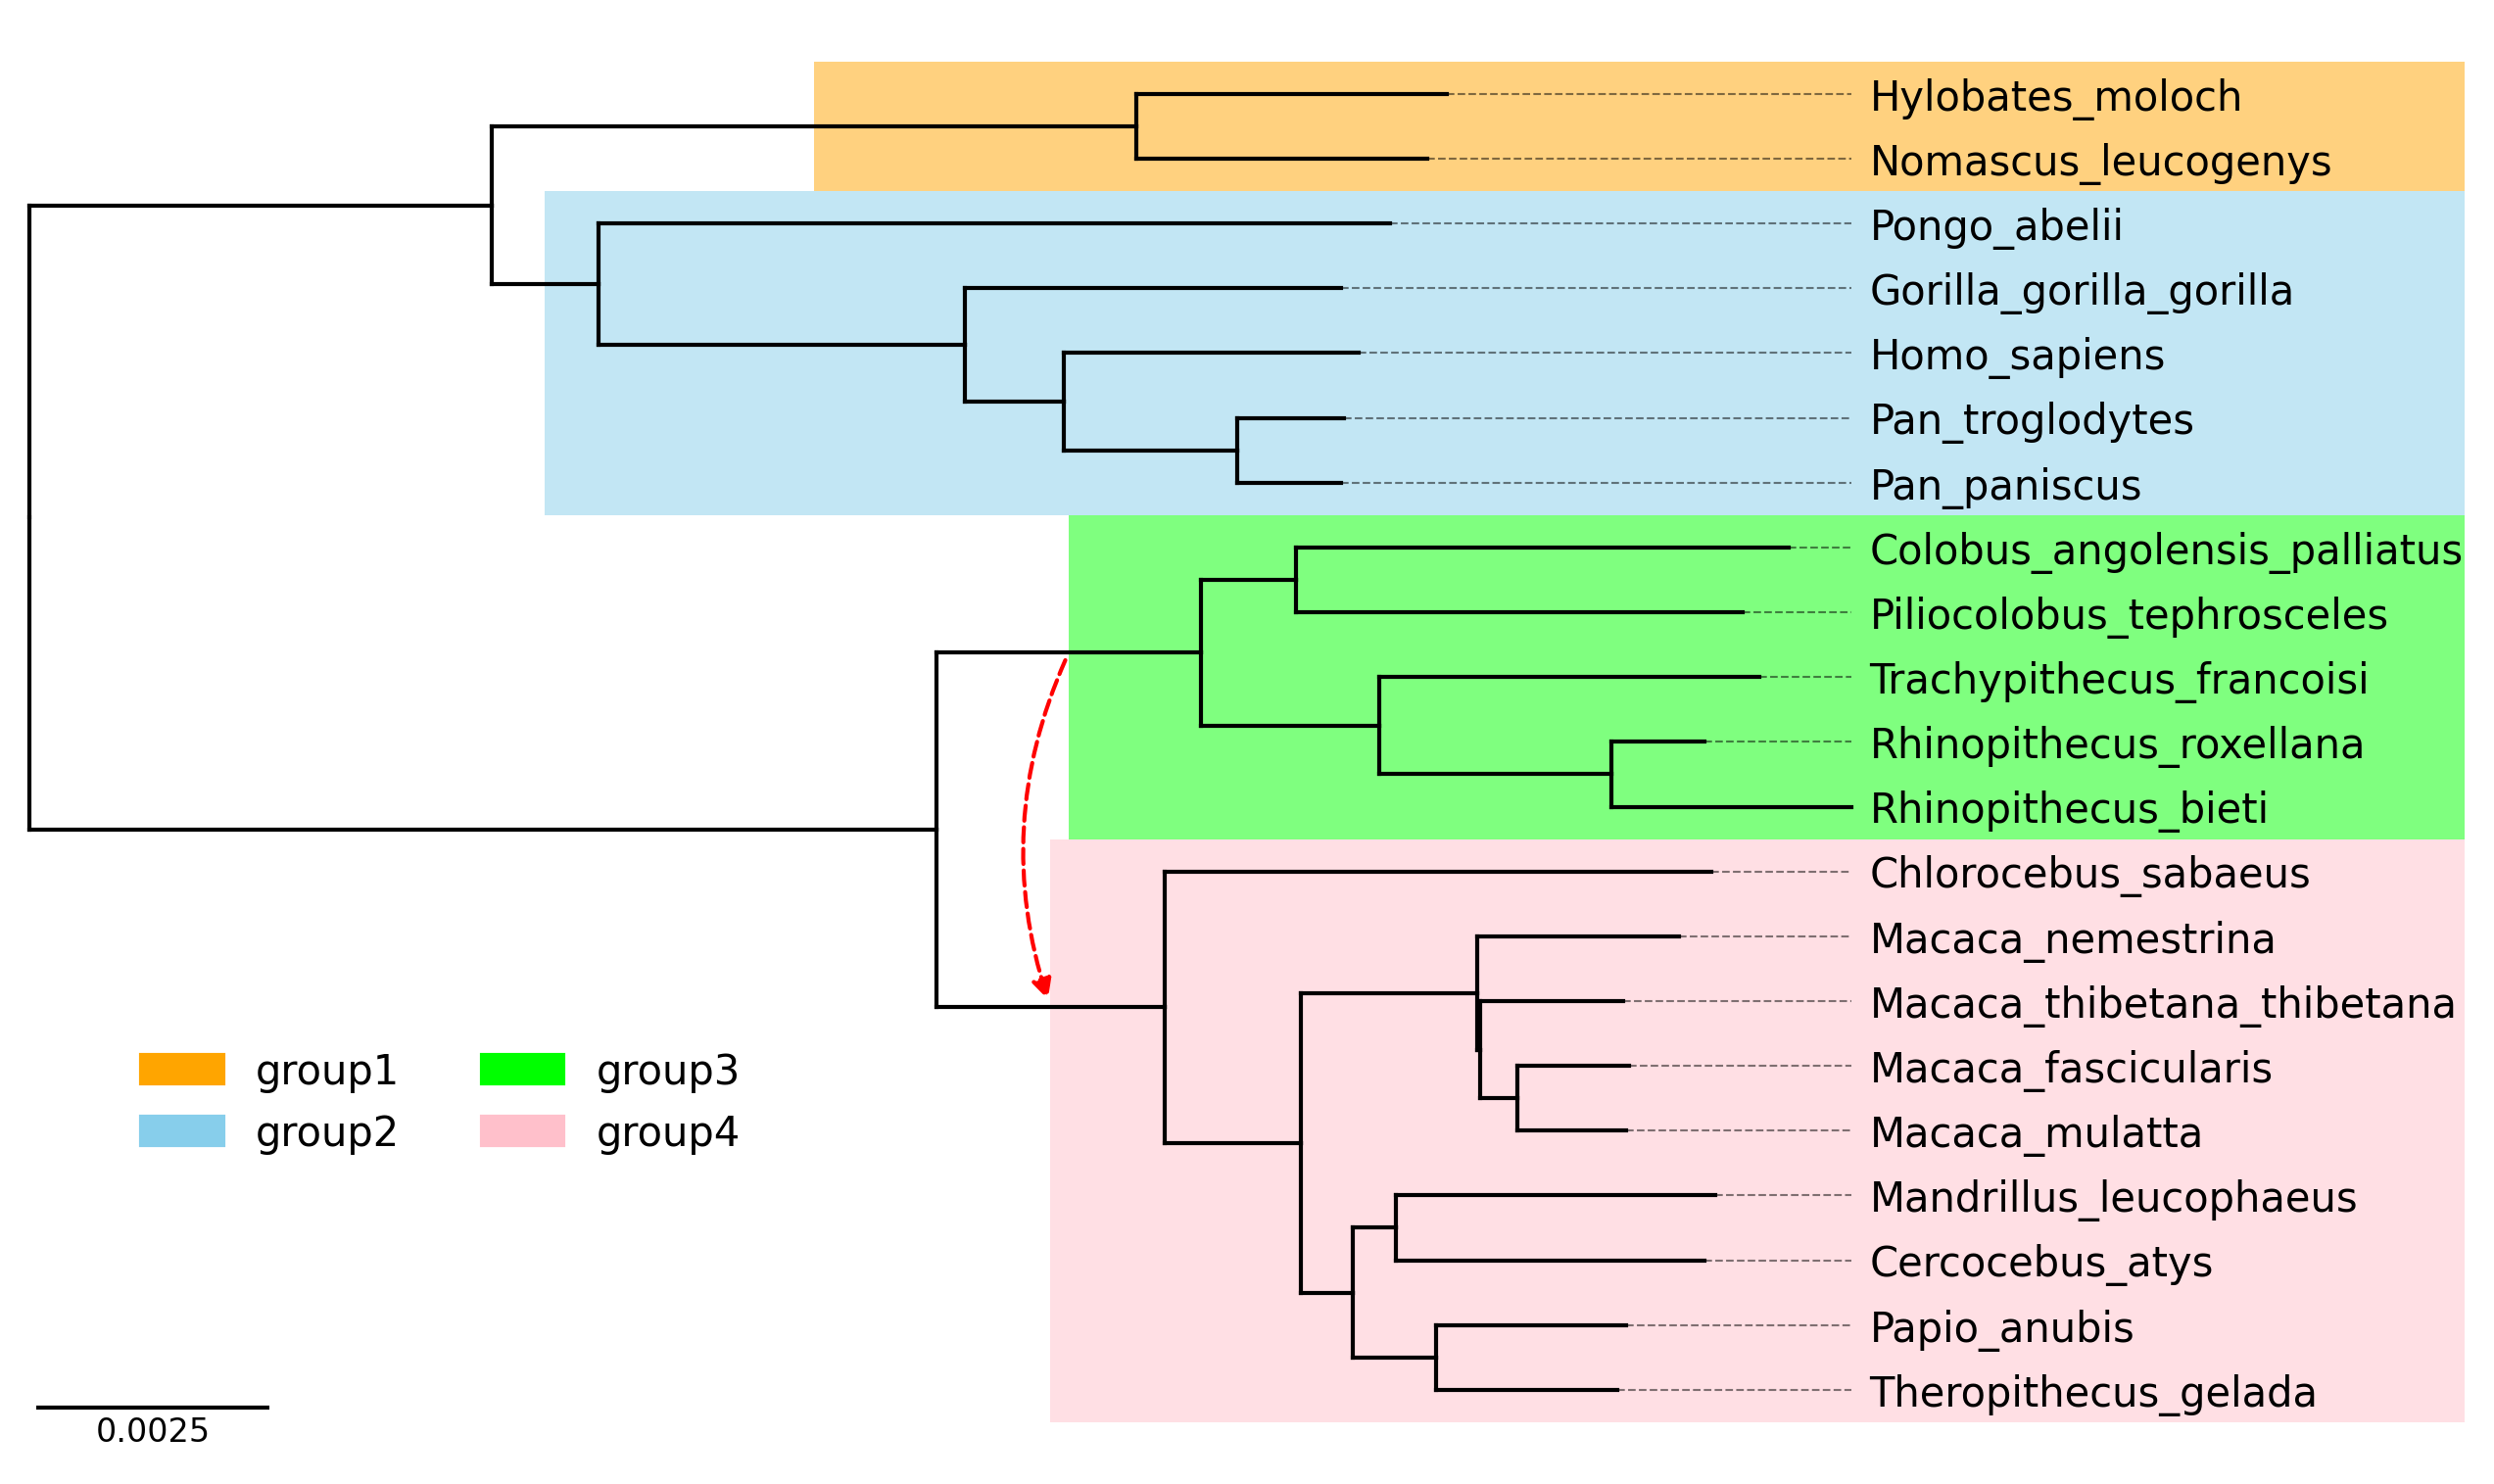
API Example 4
from phytreeviz import TreeViz, load_example_tree_file
from matplotlib.patches import Patch
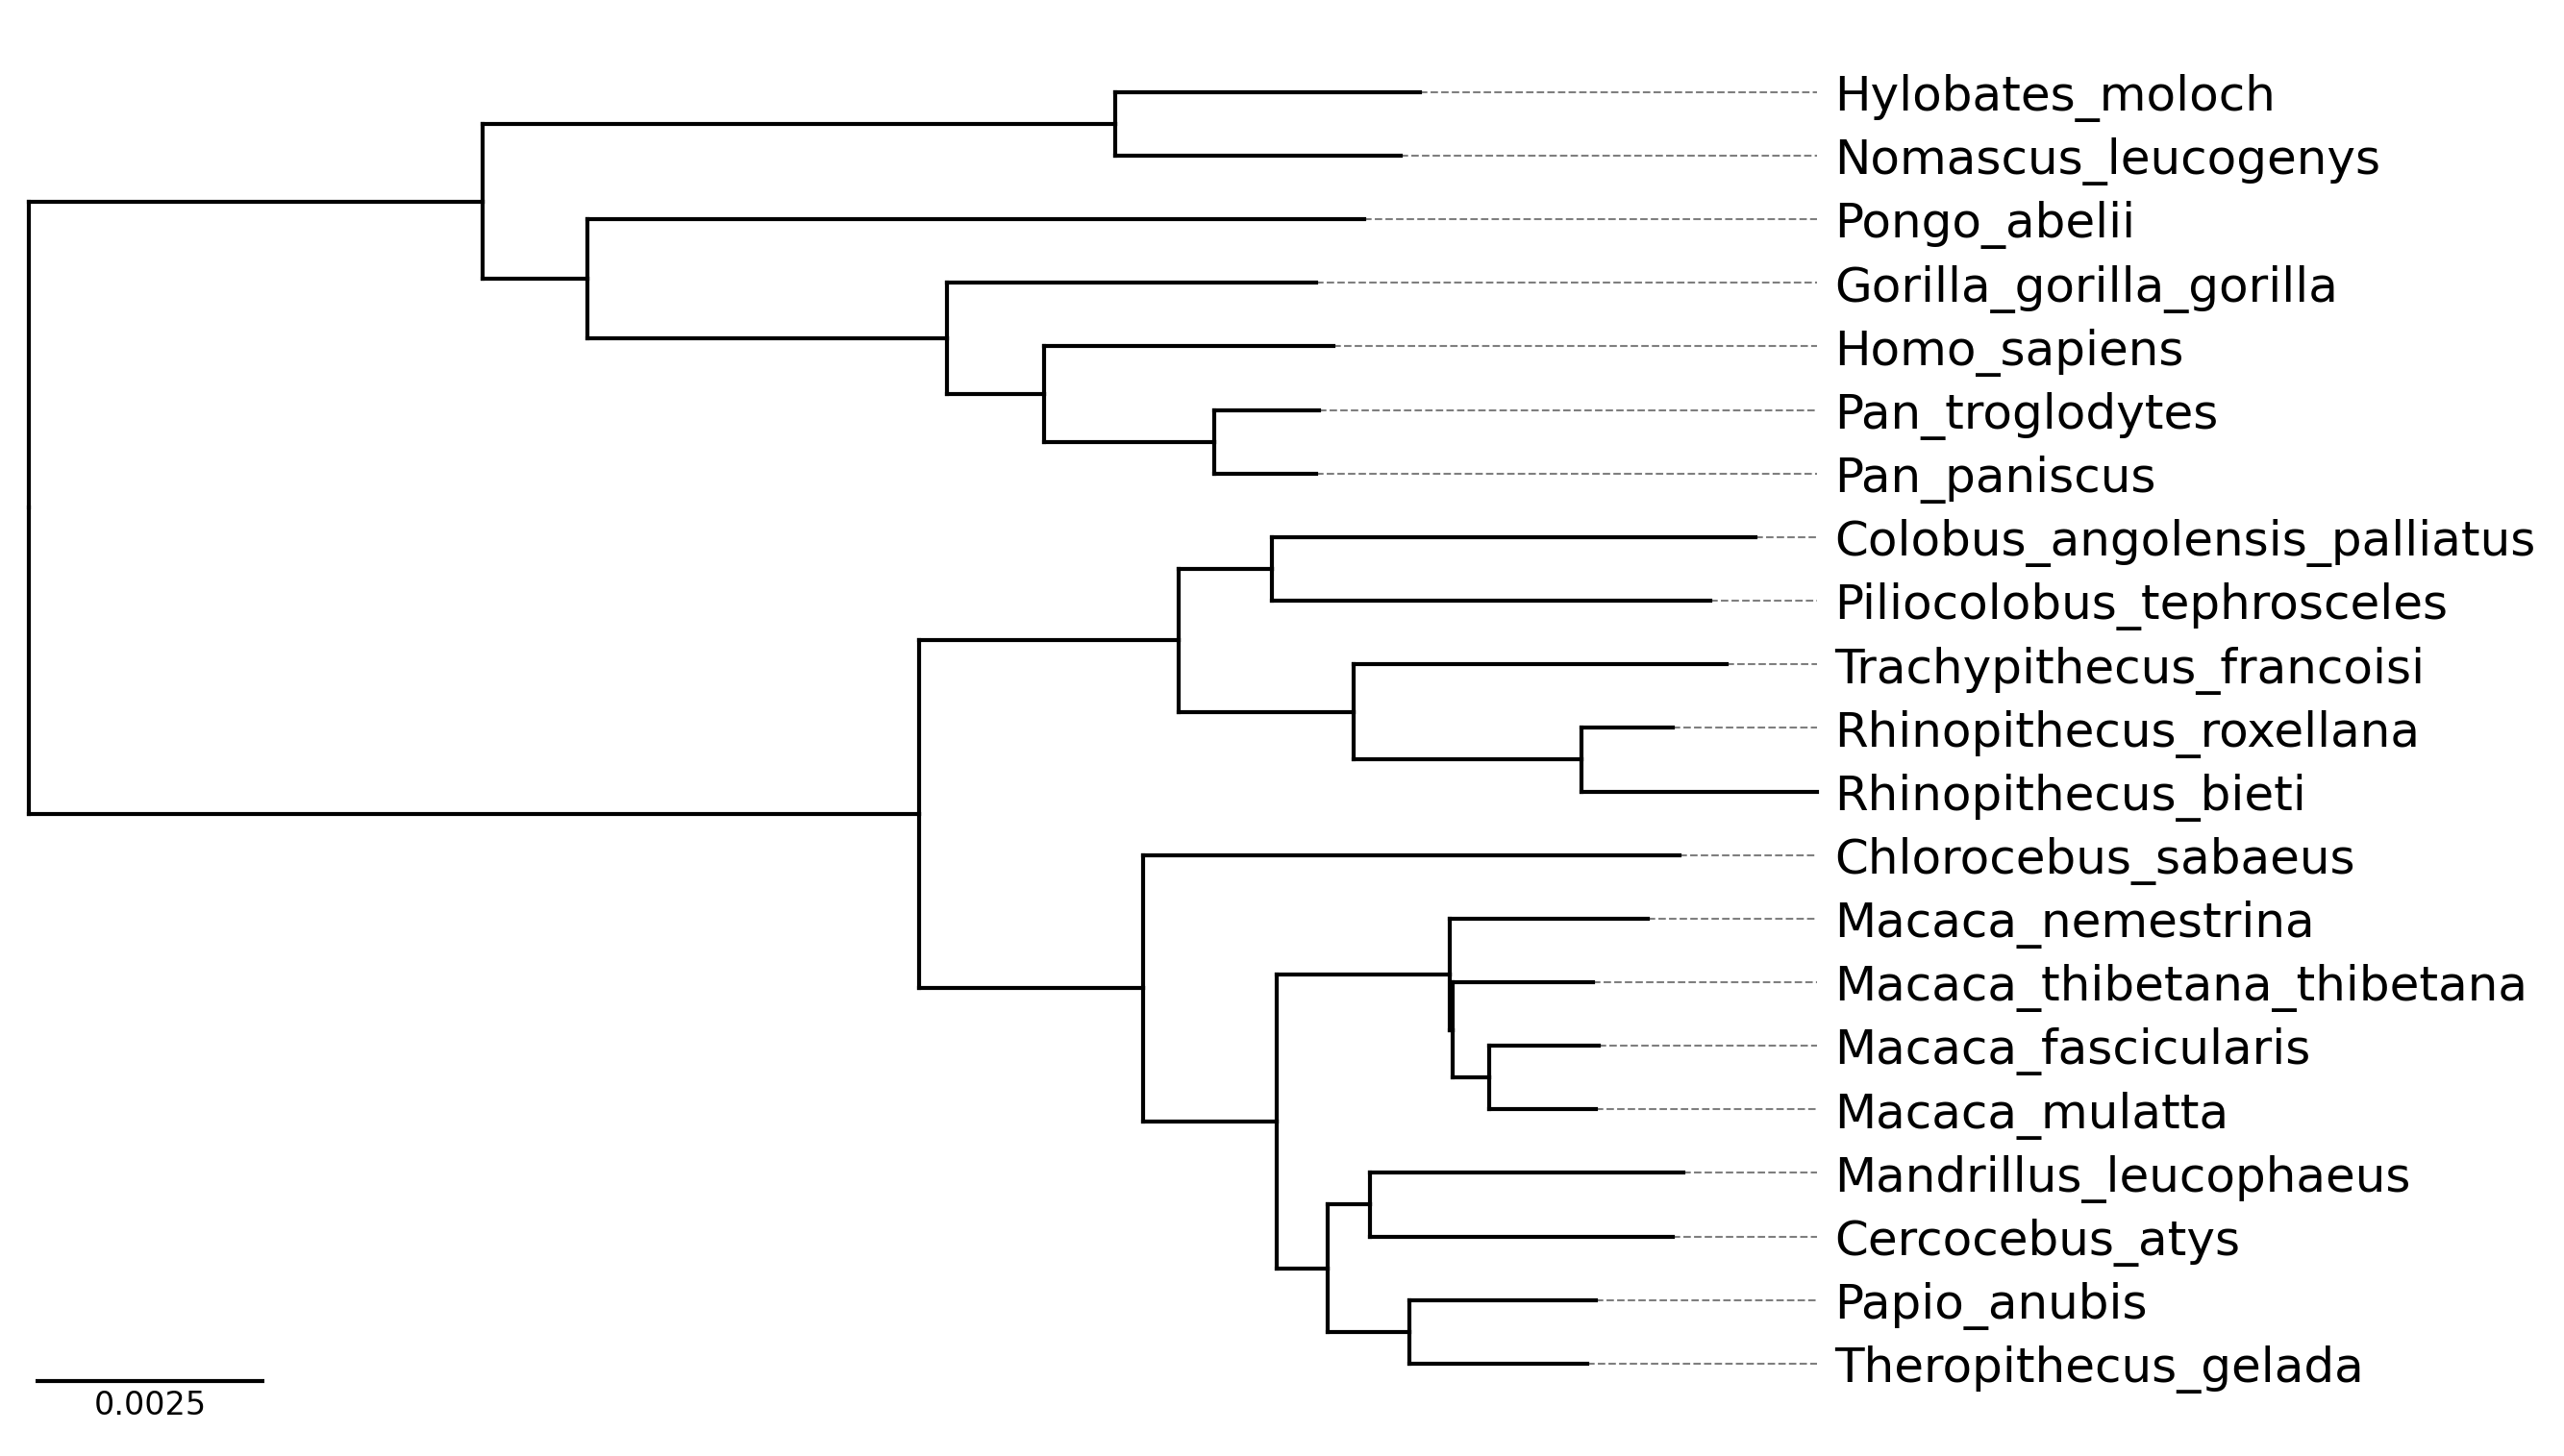
tree_file = load_example_tree_file("medium_example.nwk")
tv = TreeViz(tree_file, height=0.3, align_leaf_label=True, leaf_label_size=10)
tv.show_scale_bar()
group1 = ["Hylobates_moloch", "Nomascus_leucogenys"]
group2 = ["Homo_sapiens", "Pongo_abelii"]
group3 = ["Piliocolobus_tephrosceles", "Rhinopithecus_bieti"]
group4 = ["Chlorocebus_sabaeus", "Papio_anubis"]
tv.highlight(group1, "orange", area="full")
tv.highlight(group2, "skyblue", area="full")
tv.highlight(group3, "lime", area="full")
tv.highlight(group4, "pink", area="full")
tv.link(group3, group4, connectionstyle="arc3,rad=0.2")
fig = tv.plotfig()
_ = fig.legend(
handles=[
Patch(label="group1", color="orange"),
Patch(label="group2", color="skyblue"),
Patch(label="group3", color="lime"),
Patch(label="group4", color="pink"),
],
frameon=False,
bbox_to_anchor=(0.3, 0.3),
loc="center",
ncols=2,
)
fig.savefig("api_example04.png", dpi=300)
CLI Usage
phyTreeViz provides simple phylogenetic tree visualization CLI.
Basic Command
phytreeviz -i [Tree file or text] -o [Tree visualization file]
Options
General Options:
  -i IN, --intree IN      Input phylogenetic tree file or text
  -o OUT, --outfile OUT   Output phylogenetic tree plot file [*.png|*.jpg|*.svg|*.pdf]
  --format                Input phylogenetic tree format (Default: 'newick')
  -v, --version           Print version information
  -h, --help              Show this help message and exit

Figure Appearence Options:
  --fig_height            Figure height per leaf node of tree (Default: 0.5)
  --fig_width             Figure width (Default: 8.0)
  --leaf_label_size       Leaf label size (Default: 12)
  --ignore_branch_length  Ignore branch length for plotting tree (Default: OFF)
  --align_leaf_label      Align leaf label position (Default: OFF)
  --show_branch_length    Show branch length (Default: OFF)
  --show_confidence       Show confidence (Default: OFF)
  --dpi                   Figure DPI (Default: 300)

Available Tree Format: ['newick', 'phyloxml', 'nexus', 'nexml', 'cdao']
CLI Example
Click here to download example tree files.
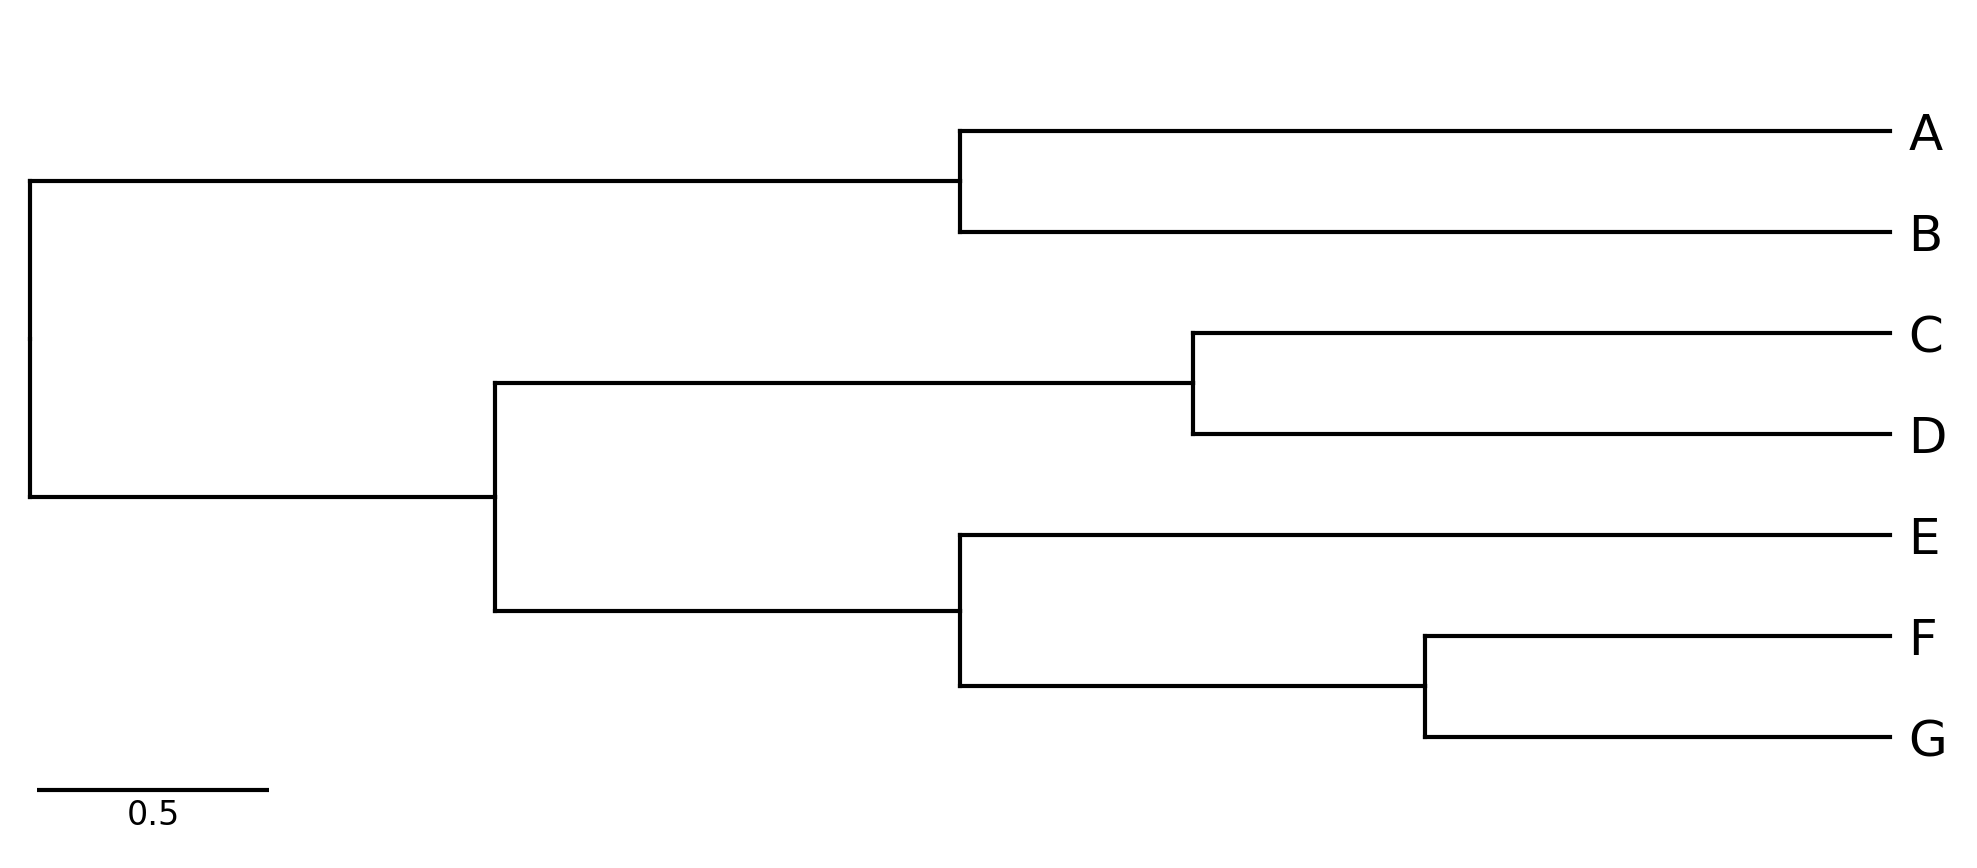
CLI Example 1
phytreeviz -i "((A,B),((C,D),(E,(F,G))));" -o cli_example01.png
CLI Example 2
phytreeviz -i ./example/small_example.nwk -o cli_example02.png \
           --show_branch_length --show_confidence
CLI Example 3
phytreeviz -i ./example/medium_example.nwk -o cli_example03.png \
           --fig_height 0.3 --align_leaf_label