New Case Study:See how Anthropic automated 95% of dependency reviews with Socket.Learn More
Socket
Sign inDemoInstall
Socket

plotly-calplot

Package Overview
Dependencies
Maintainers
1
Alerts
File Explorer

Advanced tools

Socket logo

Install Socket

Detect and block malicious and high-risk dependencies

Install

plotly-calplot

Calendar Plot made with Plotly

  • 0.1.20
  • PyPI
  • Socket score

Maintainers
1

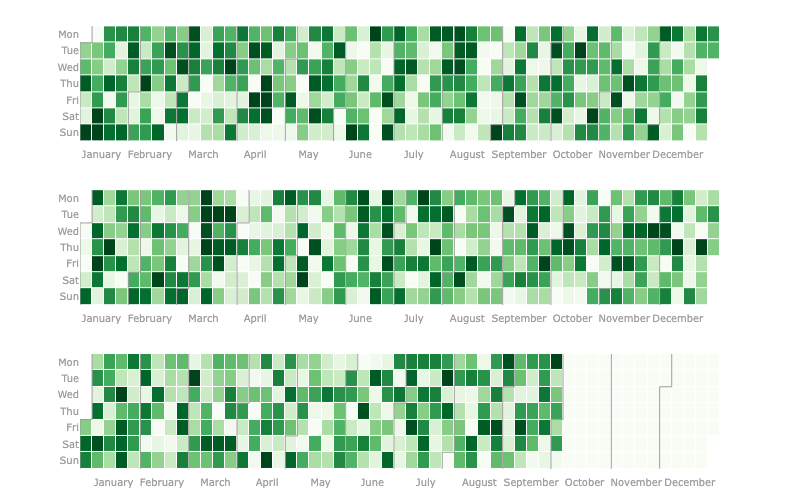
Calendar Heatmap with Plotly

Making it easier to visualize and costumize time relevant or time series data with plotly interaction.

New to the library? Read this Medium article.

This plot is a very similar to the contribuitions available on Github and Gitlab profile pages and to Calplot - which is a pyplot implementation of the calendar heatmap, thus it is not interactive right off the bat.

The first mention I could find of this plot being made with plotly was in this forum post and it got my attention as something that should be easily available to anyone.

Installation

pip install plotly-calplot

Examples

In this Medium article I covered lot's of usage methods for this library.

from plotly_calplot import calplot

fig = calplot(df, x="date", y="value")
fig.show()
# you can also adjust layout and your usual plotly stuff

FAQs


Did you know?

Socket

Socket for GitHub automatically highlights issues in each pull request and monitors the health of all your open source dependencies. Discover the contents of your packages and block harmful activity before you install or update your dependencies.

Install

Related posts

SocketSocket SOC 2 Logo

Product

  • Package Alerts
  • Integrations
  • Docs
  • Pricing
  • FAQ
  • Roadmap
  • Changelog

Packages

npm

Stay in touch

Get open source security insights delivered straight into your inbox.


  • Terms
  • Privacy
  • Security

Made with ⚡️ by Socket Inc