
Product
Introducing Rust Support in Socket
Socket now supports Rust and Cargo, offering package search for all users and experimental SBOM generation for enterprise projects.
By Trevor Norris - Jul 31, 2025
Python code for plotting professional looking reaction profiles with various customisation options available
Simplest installation
pip install plotprofile
git clone git@github.com:aligfellow/plotProfile.git
cd plotProfile
pip install .
[!WARNING] this may not respect the styles.json, if not:
git clone git@github.com:aligfellow/plotProfile.git
cd plotProfile
python -m build
pip install dist/plotprofile-1.0.1.tar.gz
Use case for example:
from plotProfile import ReactionProfilePlotter

energy_sets = {
    "Pathway A": [0.00, -2.0, 10.2, 1.4, -1.5, 2.0, -7.2],
    "Pathway B": [None, -2.0, 6.2, 4.3, 5.8, 2.0],
    "Pathway C": [None, -2.0, -6.8,-6.8],
}

annotations = {
    'Step 1': (0,3),
    'Step 2': (3,5),
    'Step 3': (5,6),
}

plotter = ReactionProfilePlotter(dashed=["Pathway C"])
plotter.plot(energy_sets, annotations=annotations, filename="../images/profile1")
Pass in annotations for labelling of the reaction profile:

A variety of paremters can be tuned for the plotting, including:
axes="box|y|x|both|None"curviness=0.42 - reduce for less curve and vice versacolors=["list","of","colors"]|cmap - specify colour list or colour mapshow_legend=Boolunits="kj|kcal"energy="e|electronic|g|gibbs|h|enthalpy|s|entropy|"For example:
plotter = ReactionProfilePlotter(style="presentation", dashed=["Pathway B"], point_type='bar', desaturate=False, colors='Blues_r', show_legend=False, curviness=0.5)
plotter.plot(energy_sets, filename="../images/profile2")
style="presentation" which sets a larger figsize=(X,X), thicker lines, larger font size:
For example:
plotter = ReactionProfilePlotter(style="straight", figsize=(6,4), dashed=["Pathway C"], point_type='dot', annotation_color='black', axes='y', colors=['darkseagreen', 'slateblue', 'darksalmon'], energy='electronic', units='kj')
plotter.plot(energy_sets,annotations=annotations, filename="../images/profile3")
curviness=0:
See examples/example.ipynb for more explicit code
[!IMPORTANT]
- Secondary curves can begin from after the 1st point, just need to have a
Noneentry in the list of energies e.g.[None, 0.0, 1.0]- Individual points can be placed if this is a list with only one energy value (e.g. uncluttered diastereomeric TS for example, see examples)
- labels of theses are not added to the legend
- these can even be placed as individual points between two indices with
[None, 5.0, 5.0]- Spacing of points on the profile can be altered by:
- passing the same energy twice in a row, which will place the point halfway between the two x-indices, i.e. Pathway C point in examples, e.g.
[0.0, 5.0, 5.0]- with an entry like
[0.0, None, 1.0]which will have a line connecting indexes 0 and 2 of this list with the correct x-axis alignment- data types can be:
- dict, with labels for the legend
- list of lists (no labelling of different profiles)
- single list
[!NOTE] Currently untested - though this won't work for now
python -m plotProfile --input examples/input.json --labels --format png
[!TIP]
- label placement is primitive and could be improved
- for now these can be tweaked with postprocessing
- check cli options
FAQs
Plot reaction profiles with customizable curves and labels
We found that plotprofile demonstrated a healthy version release cadence and project activity because the last version was released less than a year ago. It has 1 open source maintainer collaborating on the project.
Did you know?

Socket for GitHub automatically highlights issues in each pull request and monitors the health of all your open source dependencies. Discover the contents of your packages and block harmful activity before you install or update your dependencies.
Product
Socket now supports Rust and Cargo, offering package search for all users and experimental SBOM generation for enterprise projects.
Product
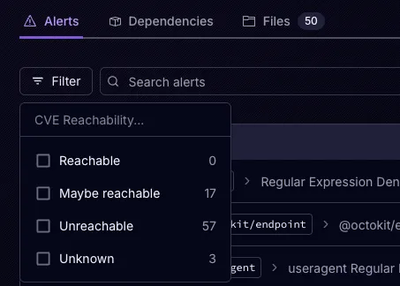
Socket’s precomputed reachability slashes false positives by flagging up to 80% of vulnerabilities as irrelevant, with no setup and instant results.
Product
Socket is launching experimental protection for Chrome extensions, scanning for malware and risky permissions to prevent silent supply chain attacks.