Polyphonic Sound Detection Score (PSDS)
psds_eval is a Python package containing a library to
calculate the Polyphonic Sound Detection Score as presented in:
A Framework for the Robust Evaluation of Sound Event Detection
C. Bilen, G. Ferroni, F. Tuveri, J. Azcarreta, S. Krstulovic
In IEEE International Conference on Acoustics, Speech, and Signal Processing (ICASSP). May 2020
https://arxiv.org/abs/1910.08440
The PSDS is a metric for evaluating Sound Event Detection (SED) systems.
Differently from other widely adopted metrics, PSDS:
- Introduces a new, flexible and robust definition of event detection that yields
an evaluation closer to the end-user perception of sound events
- Discriminates cross-triggers from generic false positives and supports
their custom weighting to cope with imbalanced datasets and to help developers
identify weaknesses in the system
- Evaluates the SED system performance using multiple operating points to truly
measure the quality of the sound event modelling without system calibration
bias
These capabilities are summarized below. For more details please
read the paper accessible from the link above.
-
Definition of event detection
When evaluating SED system performance, existing metrics constrain the
detection's start and end times to within a certain distance from
the ground truth. This determines whether the detections are correct or
not.
An example of such a constraint is commonly called "collar". While it introduces
some degree of tolerance for either human or system imperfections in the
evaluation, it also increases the need for very accurate ground truths by
requiring the detections to closely match the annotations. Suppose an audio
sample contains two very close dog barks (e.g. 200ms) and the annotator
decided to create two ground truths. A system that detects both annotations
with a single detection should not be penalised.
PSDS relaxes these constraints by introducing a flexible and more
user-oriented definition of event detection. Two parameters, expressed as a
percentage of intersection between two or more entities, are used: Detection
Tolerance Criterion (DTC) and Ground Truth intersection Criterion (GTC).
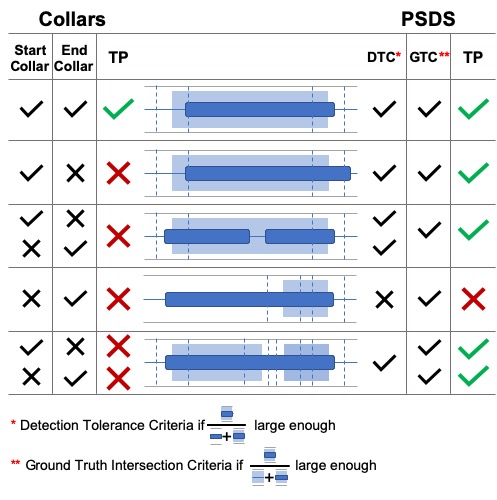
The image below shows how 5 typical scenarios are evaluated using collars
(left) and using the PSDS method (right).
The taller background rectangles are ground truths while the smaller
foreground rectangles represent the system detections. Vertical dashed lines
simulate how the ground truth boundaries are affected by the collar.
-
Cross-triggers
Suppose we have a 3-class SED system that outputs 4 detections for a given
audio sample with two sound events. The scenario is depicted in the figure
below in which ground truths and detections are indicated by background and
foreground rectangles, respectively.
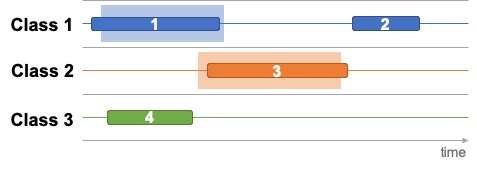
Detections 1 and 3 are clearly true positives (TP) while detections 2 and 4
are false positives (FP). In addition to this, PSDS also counts detection 4
as a cross-trigger (CT) for Class 3 on the ground truth Class 1.
The confusion matrix for this example would be:
| Class 1 | Class 2 | Class 3 | WORLD |
|---|
| Class 1 | 1 | | | 1 |
| Class 2 | | 1 | | |
| Class 3 | 1 | | | 1 |
PSDS also allows a custom weight to be applied to CTs in order to define
their importance in the final evaluation. Such weighting can be crucial when
the evaluation dataset is unbalanced. For instance, the sound of
window glass breaking rarely happens in the real world, yet the reliable
evaluation of glass breaking TPs requires a large number of positive class
samples, which may in turn artificially increase the FP counts for other
percussive classes. In such scenario, PSDS would help the developer to assess
the system performance by weighting out the cross-trigger effects. It also
helps to highlight the limits of the system and to narrow the problem down
to, perhaps, a training labels problem.
-
Operating point
Standard metrics for SED conflate the evaluation of sound event modelling
with the evaluation of operating point (OP) tuning. In other fields of
research, such as keyword spotting, this issue is solved by evaluating
multiple operating points and by reporting an overall measure, such as area
under curve. PSDS calculates the area under the Polyphonic Sound Detection
Receiver Operating Characteristic (PSD-ROC).
The image below shows an example of PSD-ROC for a SED system. The curve is
built by choosing a number of different tunings (operating points) of the
system. Let's consider the two points indicated by A (30, 0.3) and B
(30, 0.39). If the system is tuned to A, the performance is underestimated
given that for a similar false positive rate the system can achieve a
significantly higher true positive rate if tuned to B.
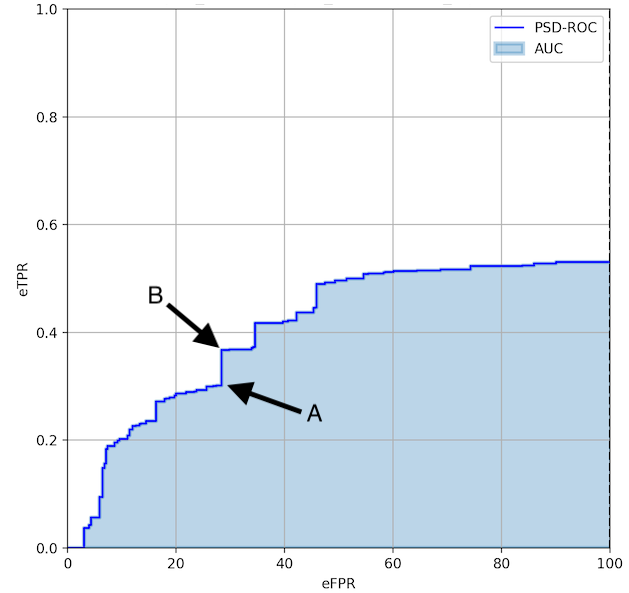
An evaluation based on multiple OPs provides a better understanding of the
system performance at different TP/FP trade-offs.
Important note:
- The PSD-ROC curve is a summary of the multiple outputs of the system under
evaluation and, unlike standard ROC curves in the binary classification case,
it does not represent every possible operating point configuration of the
evaluated system. For example, a system with two possible classes (speech and
drum) can be tuned to achieve 80% TP for speech and 70% TP for drum, but
such an operating point is not precisely represented on the PSD-ROC curve.
Hence, not all possible configurations of the given system are expected to lie
on the curve. However, the summary of the performance and how it changes for
each class is still represented in the PSD-ROC and its area (i.e. the PSDS).
- The PSD-ROC curve is monotonically increasing. However, when
alpha_st is
not 0, this can no longer be guaranteed (cf. Equation 9 in the paper linked
above).
Installation
In order to install the psds_eval package:
- Clone the repository
git clone https://github.com/DCASE-REPO/psds_eval.git cd psds_evalpip install -Ue .
Running the tests
The tests can be run using pytest with:
pytest tests
Code Example
A code example is available within the package showing how to use the library
to calculate the PSDS of a system for a given dataset.
The dataset used in the example is the validation subset from the challenge
DCASE-2019 Task 4.
For simplicity, ground truths and metadata are available within this
package under examples/data.
The baseline system provided in
Task 4
does not support an adjustable output threshold out-of-the-box. Therefore it
was modified so that a different set of detections is produced for each chosen
threshold value.
Each detection set is saved and available in the data folder. The filenames
follow the convention: baseline_<TH>.csv, where TH = 0.1, 0.2, ..., 1.0
represents the threshold value.
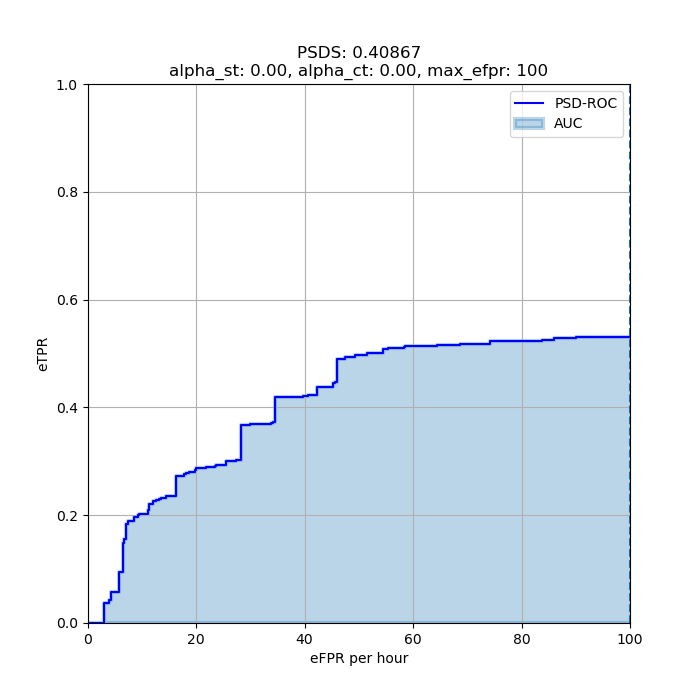
Once the psds_eval package is installed you may run the evaluation example using the
Python script from the examples folder like so:
$ python examples/run_psds.py
The script should output a PSD-Score value of 0.40867 and the plot below.
Notebook on PSDS evaluation of DCASE2020 Task 4 baseline system
A Jupyter notebook has been created to show how PSDS can be used to extract
insights on a SED system performance. It also explains in more detail certain
key features of PSDS.
The notebook is available here.
FAQ
What are all the PSDS parameters for?
One of the design principles behind psds_eval is flexibility.
In practice, the PSDS evaluation can adapt to any task constraints by
configuring the following three parameters (cf. Fig.2a article):
-
Detection Tolerance Criterion threshold (cf. Definition 2 article)
- Controls how precise a system detection has to be with respect to all the
ground truths of the same class that it intersects.
-
Ground Truth intersection Criterion threshold (cf. Definition 3 article)
- Defines the amount of minimum overlap necessary to count a ground truth
as correctly detected.
-
Cross-Trigger Tolerance Criterion threshold (cf. Definition 4 article)
- Same as DTC, but applied to the system detections that intersect ground
truths of other classes of interest for detection, as distinct from false
alarms which don’t intersect with any other label.
Moreover, the calculation of the PSDS of a system can be configured to take into
account several constraints:
-
The importance of cross-triggers can be specified in the effective False
Positive Rate definition by the parameter alpha_ct (cf. Equation 6 article)
-
The importance of inter-class variability is controlled in the definition of
the effective True Positive Ratio by the parameter alpha_st (cf. Equation 9 article)
-
The maximum effective False Positive Rate at which the area under the PSD-ROC is
computed can be adjusted by the parameter max_efpr. This value is crucial because
it defines an upper bound for the mistakes a system can make in a unit of time.
Important notes:
- More than one detection can contribute to a single true positive (TP)
- Detections contributing to TPs are not considered for cross-trigger (CT) counts
alpha_st must be a positive number
Why are multiple operating points required?
We want to evaluate a system across a range of operating points in contrast with
more classic metrics (such as F-Score or Accuracy). This approach provides
an evaluation which is more generic and independent from the system's tuning.
What is the minimum number of operating points required?
It depends on how the system behaves. We encourage the user to start with at
least 20 operating points and, based on how the PSD-ROC looks, more operating
points can be added to represent the system behaviour as accurately as possible.
Is it possible to remove the operating points for a new system evaluation?
Yes, it is possible to remove all the previously added operating points by using
the function PSDSEval.clear_all_operating_points. The evaluator is then ready
to accept new operating points and compute a new evaluation.
Important notes:
- the function only removes the stored operating points
- the dataset, defined by
PSDSEval.metadata and PSDSEval.ground_truth, is
not modified - the task definition, defined by the 3 thresholds (DTC, GTC and CTTC) stored in
self.threshold, is not modified
What are the input requirements?
All the inputs must be a pandas.DataFrame. There are two table
formats:
1. detections and ground_truth tables format
Column names are the same as those used in the DCASE evaluation.
Each row is defined by 4 values:
filename, identifies the input audio fileonset and offset are the start and end time (expressed in seconds) of
the eventevent_label is the name of the class the event belongs to
An example of ground truth table
| filename | onset | offset | event_label |
|---|
| test.wav | 2.0 | 20.0 | c1 |
| test.wav | 12.0 | 35.0 | c2 |
| test.wav | 42.0 | 47.0 | c3 |
| test2.wav | 5.0 | 20.0 | c1 |
| test2.wav | 5.0 | 30.0 | c2 |
| test2.wav | 42.0 | 47.0 | c3 |
| test3.wav | 5.0 | 18.0 | c1 |
| test3.wav | 10.0 | 30.0 | c2 |
| test3.wav | 42.0 | 48.0 | c3 |
An example of detections table
| filename | onset | offset | event_label |
|---|
| test.wav | 0.0 | 19.0 | c1 |
| test.wav | 40.0 | 45.0 | c1 |
| test.wav | 11.0 | 25.0 | c2 |
| test.wav | 27.0 | 30.0 | c2 |
| test.wav | 32.0 | 41.5 | c2 |
| test.wav | 38.0 | 48.0 | c3 |
2. metadata table format
Simply contains the duration (in seconds) for each file in the dataset:
| filename | duration |
|---|
| test.wav | 50.0 |
| test2.wav | 50.0 |
| test3.wav | 50.0 |
Important notes
metadata and ground_truth tables must have the same unique values in the
"filename" column
Is it possible to find an operating point which leads to the best F1-score?
The psds_eval package provides a function called
select_operating_points_per_class() which can help find the operating
points which best satisfy the requested criteria on TPR, FPR, eFPR or F
-score for each class. Examples on how to use this function are provided
in the example script and the jupyter notebook
.
License
psds_eval is MIT licensed, as found in the LICENSE file.