
🚀 Simple URL shortening with advanced analytics, emoji aliases, and more using spoo.me
📖 Table of Contents
📦 Installing
You can install this package using pip:
pip install py_spoo_url
📥 Importing
from py_spoo_url import Shorten, Statistics
✂️ Shortening URL
For Non-emoji aliases
shortener = Shortener()
long_url = "https://www.example.com"
short_url = shortener.shorten(long_url, password="SuperSecretPassword@444", max_clicks=100)
print(f"Shortened URL: {short_url}")
😎 For Emoji aliases
shortener = Shortener()
long_url = "https://www.example.com"
emoji_url = shorten.emojify(long_url)
print(f"Emojified URL: {emoji_url}")
Note: The emoji sequence must contain actual emojies like 😆🤯...
📊 URL Statistics
The Statistics class enables you to retrieve detailed statistics for a given short code.
🔧 Initializing the class
from spoo_me import Statistics
stats = Statistics(short_code="ga")
👀 Viewing the Basic Statistics
print(f"Total Clicks: {stats.total_clicks}")
print(f"Total Unique Clicks: {stats.total_unique_clicks}")
print(f"Average Daily Clicks: {stats.average_daily_clicks}")
print(f"Clicks Analysis: {stats.clicks_analysis}")
print(f"Browser Analysis: {stats.browsers_analysis}")
List of the analytics you can access
| total_clicks | Total number of clicks on the short URL. |
| total_unique_clicks | Total number of unique clicks on the short URL. |
| average_daily_clicks | Average number of clicks per day. |
| average_monthly_clicks | Average number of clicks per month. |
| average_weekly_clicks | Average number of clicks per week. |
| last_click | Information about the last click on the short URL. |
| last_click_browser | Browser used for the last click. |
| last_click_platform | Operating system used for the last click. |
| created_at | Date when the short URL was created. |
| creation_time | Time of day when the short URL was created. |
| browsers_analysis | Analysis of browsers used for clicks. |
| platforms_analysis | Analysis of operating systems used for clicks. |
| country_analysis | Analysis of countries from which clicks originated. |
| referrers_analysis | Analysis of referrers (sources) of clicks. |
| clicks_analysis | Detailed analysis of daily clicks. |
| unique_browsers_analysis | Analysis of unique browsers used for clicks. |
| unique_platforms_analysis | Analysis of unique operating systems for clicks. |
| unique_country_analysis | Analysis of unique countries from which clicks originated. |
| unique_referrers_analysis | Analysis of unique referrers (sources) of clicks. |
| unique_clicks_analysis | Detailed analysis of daily unique clicks. |
| expired | Indicates if the short URL has expired. |
| password | Password associated with the short URL (if any). |
Example Usage
print(f"Creation Time: {stats.creation_time}")
📈 Generating Insightful Charts
plt = stats.make_chart(data="browsers_analysis", chart_type="bar")
plt.show()
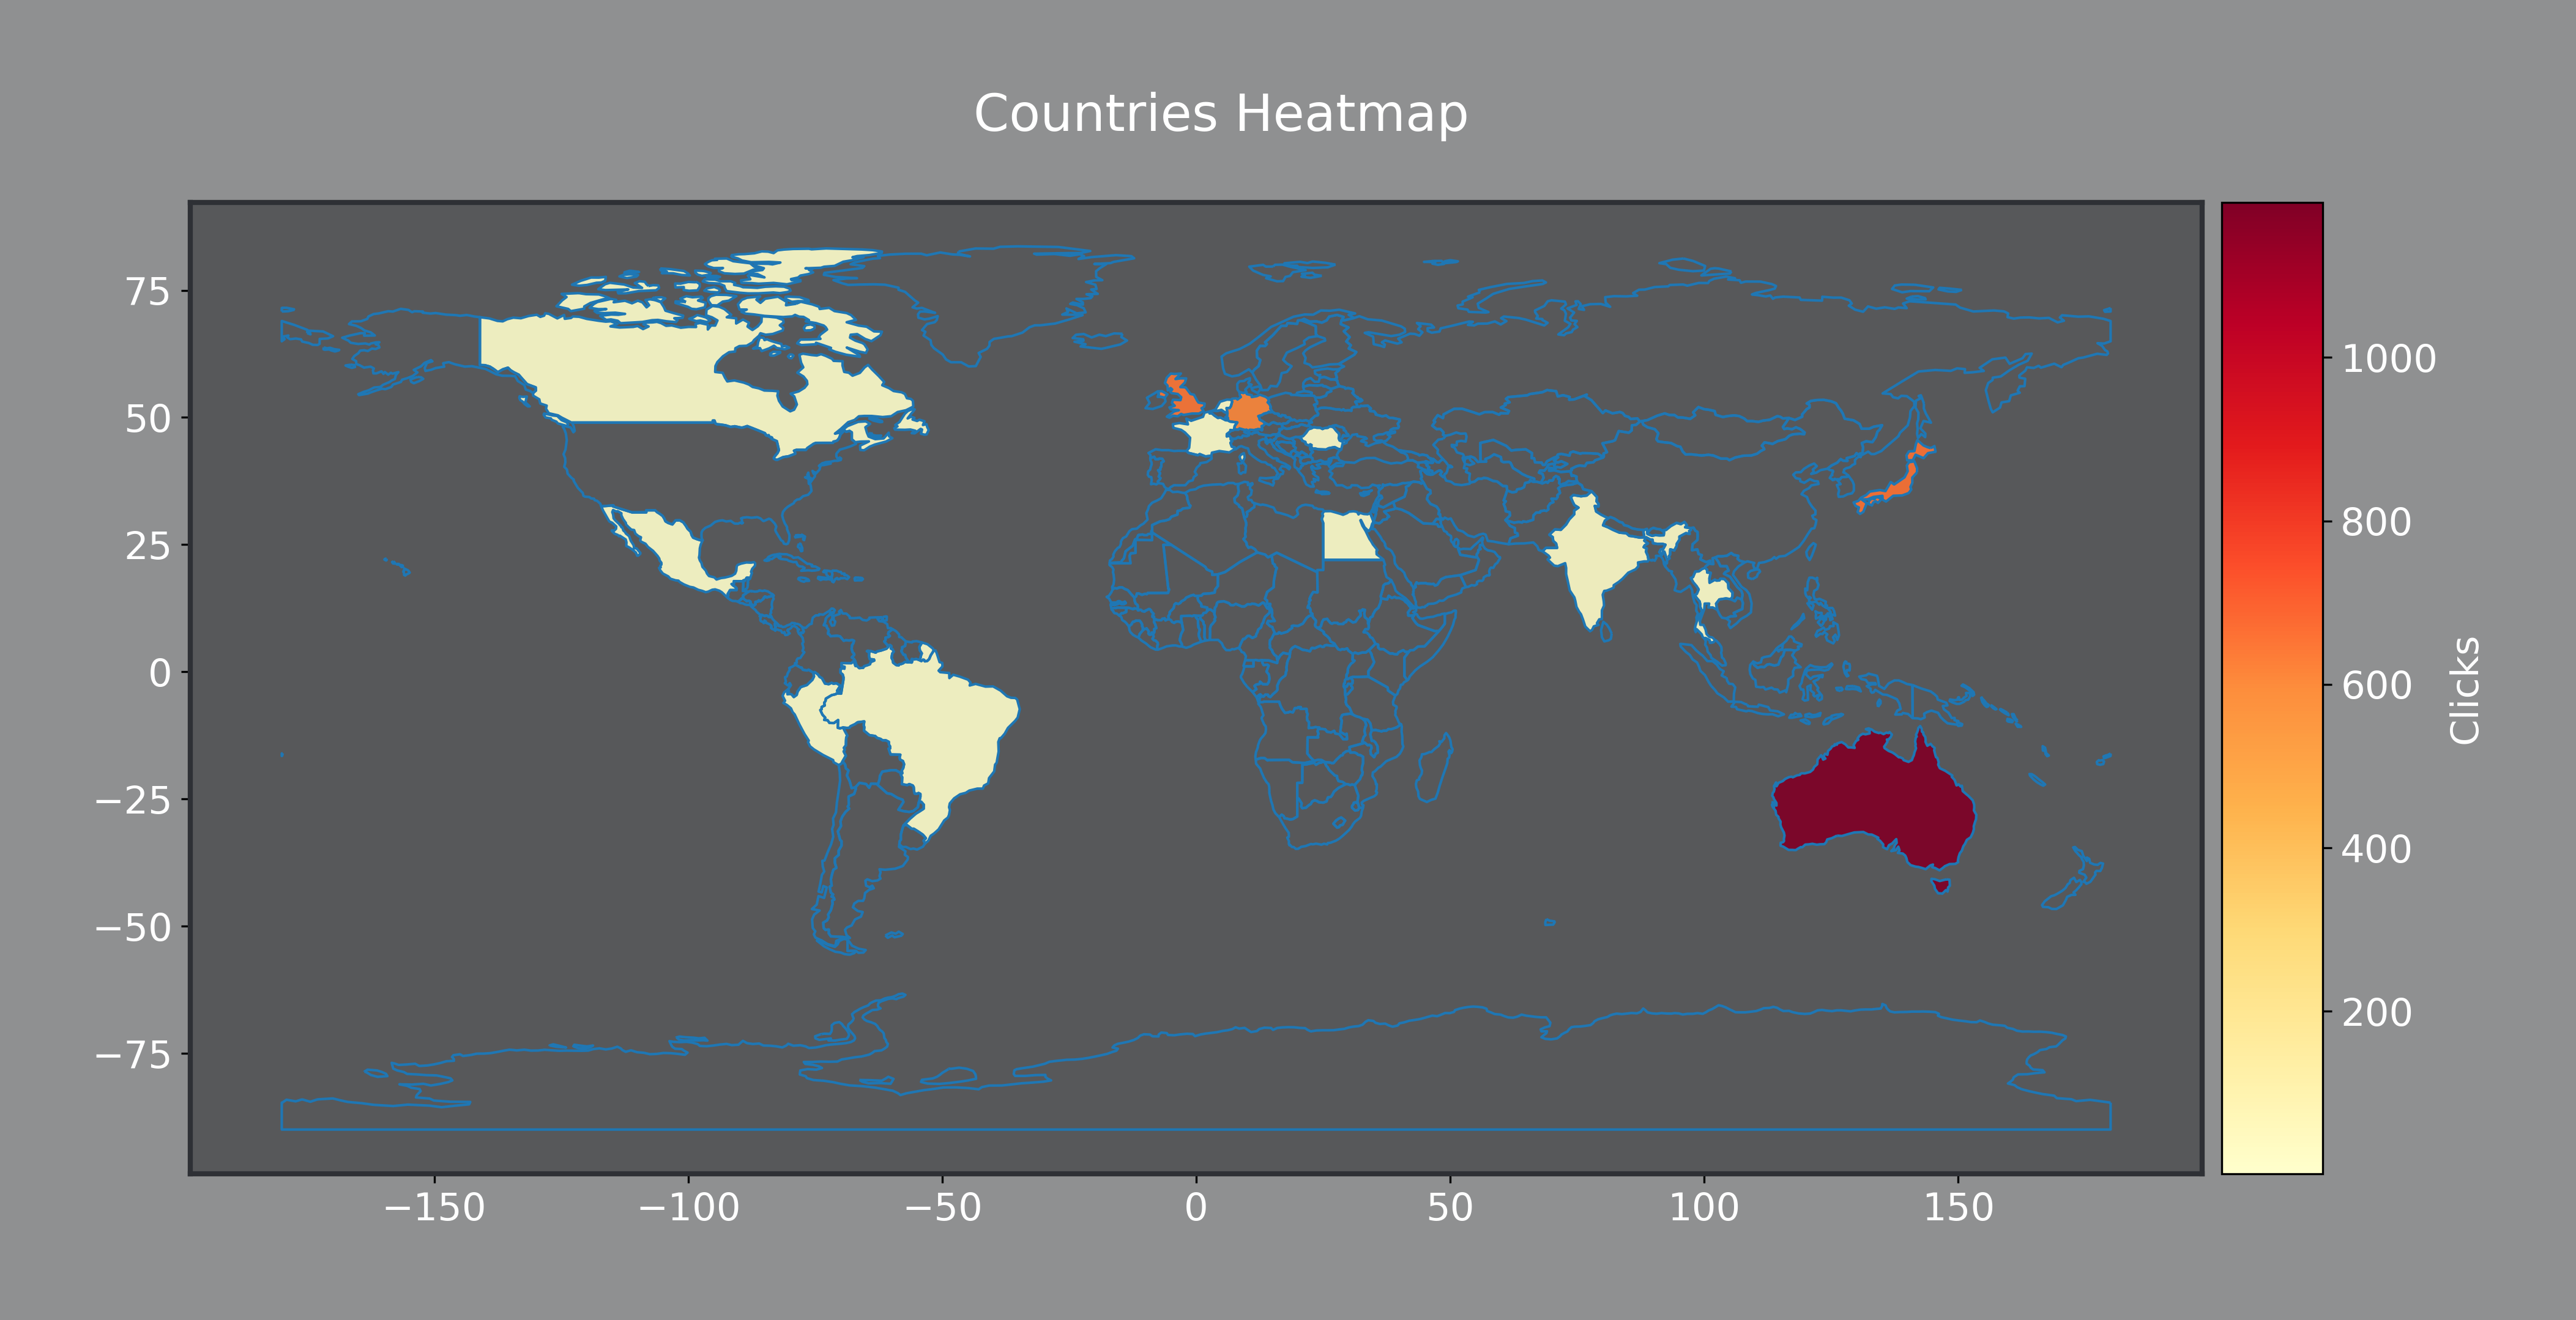
plt = stats.make_countries_heatmap()
plt.savefig("heatmap.png", format="png", bbox_inches="tight", pad_inches=0.5, dpi=300,)
plt = stats.make_unique_countries_heatmap()
plt.savefig("unique_heatmap.png", format="png", bbox_inches="tight", pad_inches=0.5, dpi=300,)
List of Available Charts
| make_chart | Create various types of charts based on the data provided. |
| data | Type of data to visualize (e.g., 'browsers_analysis', see below). |
| chart_type | Type of chart to create (e.g., "bar", "pie", "line", see below). |
| days | Number of days to consider for time-based analysis. (only for last_n_days_analysis and last_n_days_unique_analysis) |
Valid Data that can be passed to make the chart
'browsers_analysis''platforms_analysis''country_analysis''referrers_analysis''clicks_analysis''unique_browsers_analysis''unique_platforms_analysis''unique_country_analysis''unique_referrers_analysis''unique_clicks_analysis''last_n_days_analysis''last_n_days_unique_analysis'
Valid Chart types
- 'bar'
- 'pie'
- 'line'
- 'scatter'
- 'hist'
- 'box'
- 'area'
Usage Example
plt = stats.make_chart('browsers_analysis', chart_type="bar")
plt.show()
👀 Heatmap Preview
📤 Exporting Stats Data
You can export the statistical data to various file formats, including Excel, CSV, and JSON:
stats.export_data(filename="stats_export.xlsx", filetype="xlsx")
stats.export_data(filename="stats_export", filetype="csv")
stats.export_data(filename="stats_export.json", filetypes="json")
🧳 Dependencies
matplotlib: For creating charts and visualizations.requests: For making HTTP requests to the Spoo.me API.pandas: For handling and manipulating data in tabular form. 🐼geopandas: For creating geographical visualizations. 🌎
All of the dependencies are automatically installed while installing the package but in case of any errors, you can install all of the dependencies listed in the requirements.txt file.
🚨 Error Codes
To see the error codes returned by the API, please visit https://spoo.me/api
🤝 Support and Issues
If you encounter any issues or have questions about using the Spoo.me Python package, please open an issue on the GitHub repository.
🤗 Contributing
Contributions are welcome! If you have ideas for improvements or new features, feel free to fork the repository, make your changes, and submit a pull request
📜 Licence
This package is licensed under the MIT License - see the LICENSE file for details.


© spoo.me . 2024
All Rights Reserved