Product
Introducing Socket Fix for Safe, Automated Dependency Upgrades
Automatically fix and test dependency updates with socket fix—a new CLI tool that turns CVE alerts into safe, automated upgrades.
By John-David Dalton - Apr 25, 2025
A versatile Python toolkit for programmatically generating, manipulating, and assembling scalable vector graphics (SVG) images.
pyDreamplet is a low-level library for SVG image generation — perfect for creating beautiful data visualizations with Python. Its intuitive API lets you build complex, scalable SVG graphics effortlessly, making it an ideal choice for projects ranging from simple charts to intricate visualizations.
Install pyDreamplet using your preferred package manager:
With poetry:
poetry add pydreamplet
With pip:
pip install pydreamplet
For complete documentation, tutorials, and API references, please visit pyDreampled documentation
This example showcases a sophisticated, multidimensional SVG visualization that displays supplier quality performance metrics. In this visualization, data dimensions such as defect occurrences, defect quantity, and spend are combined to provide an insightful overview of supplier performance. The visualization uses color, shape, and layout to encode multiple measures, allowing users to quickly identify strengths and weaknesses across suppliers.

This example uses pyDreamplet to create an engaging animated visualization featuring a series of circles. The animation leverages dynamic properties like stroke color and radius, which are mapped using linear and color scales. Each circle’s position and size are animated over time, creating a pulsating, rotating effect that results in a visually striking pattern.

Here's a quick example of how to create a waffle chart using pyDreamplet:
import pydreamplet as dp
from pydreamplet.colors import random_color

data = [130, 65, 108]


def waffle_chart(data, side=300, rows=10, cols=10, gutter=5, colors=["blue"]):
    sorted_data = sorted(data, reverse=True)
    while len(colors) < len(sorted_data):
        colors.append(random_color())

    svg = dp.SVG(side, side)

    total_cells = rows * cols
    total = sum(data)
    proportions = [int(round(d / total * total_cells, 0)) for d in sorted_data]
    print("Proportions:", proportions)

    cell_side = (side - (cols + 1) * gutter) / cols

    cell_group_map = []
    for group_index, count in enumerate(proportions):
        cell_group_map.extend([group_index] * count)

    if len(cell_group_map) < total_cells:
        cell_group_map.extend([None] * (total_cells - len(cell_group_map)))

    paths = {i: "" for i in range(len(sorted_data))}

    for i in range(total_cells):
        col = i % cols
        row = i // cols

        x = gutter + col * (cell_side + gutter)
        y = gutter + row * (cell_side + gutter)

        group = cell_group_map[i]
        if group is not None:
            paths[group] += f"M {x} {y} h {cell_side} v {cell_side} h -{cell_side} Z "

    for group_index, d_str in paths.items():
        if d_str:
            path = dp.Path(d=d_str, fill=colors[group_index])
            svg.append(path)

    return svg


svg = waffle_chart(data)
svg.display()  # in jupyter notebook
svg.save("waffle_chart.svg")

I welcome contributions from the community! Whether you have ideas for new features, bug fixes, or improvements to the documentation, your input is invaluable.
This project is licensed under the MIT License.
FAQs
A versatile Python toolkit for programmatically generating, manipulating, and assembling scalable vector graphics (SVG) images.
We found that pydreamplet demonstrated a healthy version release cadence and project activity because the last version was released less than a year ago. It has 1 open source maintainer collaborating on the project.
Did you know?

Socket for GitHub automatically highlights issues in each pull request and monitors the health of all your open source dependencies. Discover the contents of your packages and block harmful activity before you install or update your dependencies.
Product
Automatically fix and test dependency updates with socket fix—a new CLI tool that turns CVE alerts into safe, automated upgrades.

Security News
CISA denies CVE funding issues amid backlash over a new CVE foundation formed by board members, raising concerns about transparency and program governance.
Product
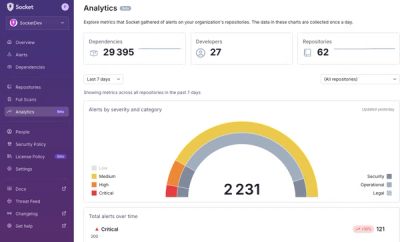
We’re excited to announce a powerful new capability in Socket: historical data and enhanced analytics.