Research
/Security News
Critical Vulnerability in NestJS Devtools: Localhost RCE via Sandbox Escape
A flawed sandbox in @nestjs/devtools-integration lets attackers run code on your machine via CSRF, leading to full Remote Code Execution (RCE).
A toolkit for visualizations in materials informatics.
If you use
pymatvizin your research, see how to cite. Check out 23 existing papers usingpymatvizfor inspiration!
pip install pymatviz
See pyproject.toml for available extras like pip install 'pymatviz[brillouin]' to render 3d Brillouin zones.
See the /api page.
See the Jupyter notebooks under examples/ for how to use pymatviz. PRs with additional examples are welcome! 🙏
| matbench_dielectric_eda.ipynb | Launch Codespace | |
| mp_bimodal_e_form.ipynb | Launch Codespace | |
| matbench_perovskites_eda.ipynb | Launch Codespace | |
| mprester_ptable.ipynb | Launch Codespace |
See pymatviz/ptable/plotly.py. The module supports heatmaps, heatmap splits (multiple values per element), histograms, scatter plots and line plots. All visualizations are interactive through Plotly and support displaying additional data on hover.
[!WARNING] Version 0.16.0 of
pymatvizdropped the matplotlib-based functions inptable_matplotlib.pyin https://github.com/janosh/pymatviz/pull/270. Please use theplotly-based functions shown below instead which have feature parity, interactivity and better test coverage.
ptable_heatmap_plotly()See examples/mprester_ptable.ipynb.
phonon_bands(bands_dict) | phonon_dos(doses_dict) |
|---|---|
phonon_bands_and_dos(bands_dict, doses_dict) | phonon_bands_and_dos(single_bands, single_dos) |
cluster_compositions(compositions, properties, embedding_method, projection_method, n_components=2) | cluster_compositions(compositions, properties, embedding_method, projection_method, n_components=3) |
|---|---|
Visualize 2D or 3D relationships between compositions and properties using multiple embedding and dimensionality reduction techniques:
Embedding methods: One-hot encoding of element fractions, Magpie features (elemental properties), Matscholar element embeddings, MEGNet element embeddings
Dimensionality reduction methods: PCA (linear), t-SNE (non-linear), UMAP (non-linear), Isomap (non-linear), Kernel PCA (non-linear)
Example usage:
import pymatviz as pmv
from pymatgen.core import Composition

compositions = ("Fe2O3", "Al2O3", "SiO2", "TiO2")

# Create embeddings
embeddings = pmv.cluster.composition.one_hot_encode(compositions)
comp_emb_map = dict(zip(compositions, embeddings, strict=True))

# Plot with optional property coloring
fig = pmv.cluster_compositions(
    compositions=comp_emb_map,
    properties=[1.0, 2.0, 3.0, 4.0],  # Optional property values
    prop_name="Property",  # Optional property label
    embedding_method="one-hot",  # or "magpie", "matscholar_el", "megnet_el", etc.
    projection_method="pca",  # or "tsne", "umap", "isomap", "kernel_pca", etc.
    show_chem_sys="shape",  # works best for small number of compositions; "color" | "shape" | "color+shape" | None
    n_components=2,  # or 3 for 3D plots
)
fig.show()
On the roadmap but no ETA yet.
See pymatviz/structure/plotly.py.
structure_3d(hea_structure) | structure_3d(lco_supercell) |
|---|---|
structure_2d(six_structs) | structure_3d(six_structs) |
See pymatviz/widgets. Interactive 3D structure, molecular dynamics trajectory and composition visualization widgets for Jupyter, Marimo, and VSCode notebooks, powered by anywidget and MatterViz (https://github.com/janosh/matterviz). Supports pymatgen Structure, ASE Atoms, and PhonopyAtoms, as well as ASE, pymatgen and plain Python trajectory formats.
from pymatviz import StructureWidget, CompositionWidget, TrajectoryWidget
from pymatgen.core import Structure, Composition

# Interactive 3D structure visualization
structure = Structure.from_file("structure.cif")
struct_widget = StructureWidget(structure=structure)

# Interactive composition visualization
composition = Composition("Fe2O3")
comp_widget = CompositionWidget(composition=composition)

# Interactive trajectory visualization
trajectory1 = [struct1, struct2, struct3]  # List of structures
traj_widget1 = TrajectoryWidget(trajectory=trajectory1)

trajectory2 = [{"structure": struct1, "energy": 1.0}, {"structure": struct2, "energy": 2.0}, {"structure": struct3, "energy": 3.0}]  # dicts with "structure" and property values
traj_widget2 = TrajectoryWidget(trajectory=trajectory2)
Examples:
[!TIP] Checkout the ✅ MatterViz VSCode extension for using the same viewers directly in VSCode/Cursor editor tabs for rendering local and remote files: marketplace.visualstudio.com/items?itemName=janosh.matterviz
Importing pymatviz auto-registers all widgets for their respective sets of supported objects via register_matterviz_widgets(). To customize the registration, use set_renderer().
brillouin_zone_3d(cubic_struct) | brillouin_zone_3d(hexagonal_struct) |
|---|---|
brillouin_zone_3d(monoclinic_struct) | brillouin_zone_3d(orthorhombic_struct) |
See pymatviz/xrd.py.
xrd_pattern(pattern) | xrd_pattern({key1: patt1, key2: patt2}) |
|---|---|
xrd_pattern(struct_dict, stack="horizontal") | xrd_pattern(struct_dict, stack="vertical") |
element_pair_rdfs(pmg_struct) | element_pair_rdfs({"A": struct1, "B": struct2}) |
|---|---|
See pymatviz/coordination/plotly.py.
coordination_hist(struct_dict) | coordination_hist(struct_dict, by_element=True) |
|---|---|
coordination_vs_cutoff_line(struct_dict, strategy=None) | coordination_vs_cutoff_line(struct_dict, strategy=None) |
See pymatviz/sunburst.py.
spacegroup_sunburst([65, 134, 225, ...]) | chem_sys_sunburst(["FeO", "Fe2O3", "LiPO4", ...]) |
|---|---|
chem_env_sunburst(single_struct) | chem_env_sunburst(multiple_structs) |
See pymatviz/treemap/chem_sys.py.
rainclouds(two_key_dict) | rainclouds(three_key_dict) |
|---|---|
See pymatviz/sankey.py.
sankey_from_2_df_cols(df_perovskites) | sankey_from_2_df_cols(df_space_groups) |
|---|---|
See pymatviz/bar.py.
spacegroup_bar([65, 134, 225, ...]) | spacegroup_bar(["C2/m", "P-43m", "Fm-3m", ...]) |
|---|---|
elements_hist(compositions, log=True, bar_values='count') | histogram({'key1': values1, 'key2': values2}) |
|---|---|
See pymatviz/scatter.py.
qq_gaussian(y_true, y_pred, y_std) | qq_gaussian(y_true, y_pred, y_std: dict) |
|---|---|
error_decay_with_uncert(y_true, y_pred, y_std) | error_decay_with_uncert(y_true, y_pred, y_std: dict) |
See pymatviz/classify/confusion_matrix.py.
confusion_matrix(conf_mat, ...) | confusion_matrix(y_true, y_pred, ...) |
|---|---|
See pymatviz/classify/curves.py.
roc_curve_plotly(targets, probs_positive) | precision_recall_curve_plotly(targets, probs_positive) |
|---|---|
pymatvizSee citation.cff or cite the Zenodo record using the following BibTeX entry:
@software{riebesell_pymatviz_2022,
  title = {Pymatviz: visualization toolkit for materials informatics},
  author = {Riebesell, Janosh and Yang, Haoyu and Goodall, Rhys and Baird, Sterling G.},
  date = {2022-10-01},
  year = {2022},
  doi = {10.5281/zenodo.7486816},
  url = {https://github.com/janosh/pymatviz},
  note = {10.5281/zenodo.7486816 - https://github.com/janosh/pymatviz},
  urldate = {2023-01-01}, % optional, replace with your date of access
  version = {0.8.2}, % replace with the version you use
}
pymatvizSorted by number of citations, then year. Last updated 2025-05-07. Auto-generated from Google Scholar. Manual additions via PR welcome.
FAQs
A toolkit for visualizations in materials informatics
We found that pymatviz demonstrated a healthy version release cadence and project activity because the last version was released less than a year ago. It has 1 open source maintainer collaborating on the project.
Did you know?

Socket for GitHub automatically highlights issues in each pull request and monitors the health of all your open source dependencies. Discover the contents of your packages and block harmful activity before you install or update your dependencies.

Research
/Security News
A flawed sandbox in @nestjs/devtools-integration lets attackers run code on your machine via CSRF, leading to full Remote Code Execution (RCE).

Product
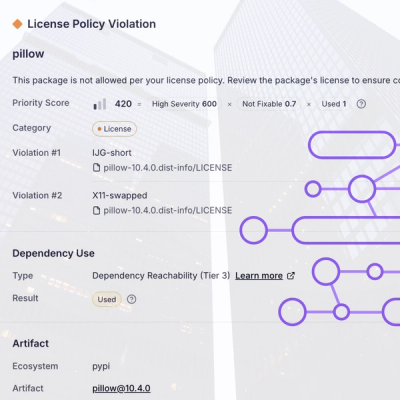
Customize license detection with Socket’s new license overlays: gain control, reduce noise, and handle edge cases with precision.

Product
Socket now supports Rust and Cargo, offering package search for all users and experimental SBOM generation for enterprise projects.