Product
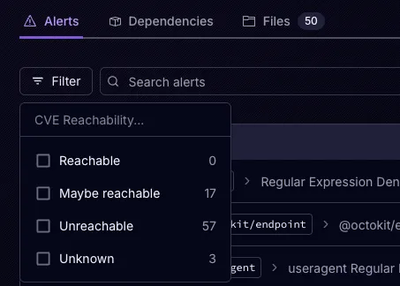
Announcing Precomputed Reachability Analysis in Socket
Socket’s precomputed reachability slashes false positives by flagging up to 80% of vulnerabilities as irrelevant, with no setup and instant results.
Help visualize profiling data from cProfile with kcachegrind and qcachegrind
Script to help visualize profiling data collected with the cProfile Python module with the kcachegrind_ (screenshots_) graphical calltree analyser.
This is a rebranding of the venerable http://www.gnome.org/~johan/lsprofcalltree.py script by David Allouche et Al. It aims at making it easier to distribute (e.g. through PyPI) and behave more like the scripts of the debian kcachegrind-converters_ package. The final goal is to make it part of the official upstream kdesdk_ package.
.. _kcachegrind: http://kcachegrind.sourceforge.net .. _kcachegrind-converters: https://packages.debian.org/en/stable/kcachegrind-converters .. _kdesdk: http://websvn.kde.org/trunk/KDE/kdesdk/kcachegrind/converters/ .. _screenshots: http://images.google.fr/images?q=kcachegrind
Upon installation you should have a pyprof2calltree script in your path::
$ pyprof2calltree --help usage: pyprof2calltree [-h] [-o output_file_path] [-i input_file_path] [-k] [-r scriptfile [args ...]]
optional arguments: -h, --help show this help message and exit -o output_file_path, --outfile output_file_path Save calltree stats to -i input_file_path, --infile input_file_path Read Python stats from -k, --kcachegrind Run the kcachegrind tool on the converted data -r scriptfile [args ...], --run-script scriptfile [args ...] Name of the Python script to run to collect profiling data
pyprof2calltree is also best used from an interactive Python shell such as
the default shell. For instance let us profile XML parsing::
from xml.etree import ElementTree from cProfile import Profile xml_content = '\n' + '\ttext\n' * 100 + '' profiler = Profile() profiler.runctx( ... "ElementTree.fromstring(xml_content)", ... locals(), globals())
from pyprof2calltree import convert, visualize visualize(profiler.getstats()) # run kcachegrind convert(profiler.getstats(), 'profiling_results.kgrind') # save for later
or with the ipython_::
In [1]: %doctest_mode Exception reporting mode: Plain Doctest mode is: ON
from xml.etree import ElementTree xml_content = '\n' + '\ttext\n' * 100 + '' %prun -D out.stats ElementTree.fromstring(xml_content)
*** Profile stats marshalled to file 'out.stats'
from pyprof2calltree import convert, visualize visualize('out.stats') convert('out.stats', 'out.kgrind')
results = %prun -r ElementTree.fromstring(xml_content) visualize(results)
.. _ipython: https://ipython.org/
FAQs
Help visualize profiling data from cProfile with kcachegrind and qcachegrind
We found that pyprof2calltree demonstrated a healthy version release cadence and project activity because the last version was released less than a year ago. It has 2 open source maintainers collaborating on the project.
Did you know?

Socket for GitHub automatically highlights issues in each pull request and monitors the health of all your open source dependencies. Discover the contents of your packages and block harmful activity before you install or update your dependencies.

Product
Socket’s precomputed reachability slashes false positives by flagging up to 80% of vulnerabilities as irrelevant, with no setup and instant results.

Product
Socket is launching experimental protection for Chrome extensions, scanning for malware and risky permissions to prevent silent supply chain attacks.

Product
Add secure dependency scanning to Claude Desktop with Socket MCP, a one-click extension that keeps your coding conversations safe from malicious packages.