RNA Geometric Library (rnaglib)
RNAglib is a Python package for studying RNA 2.5D and 3D structures. Functionality includes automated data loading,
analysis, visualization, ML model building and benchmarking.

A web-based documentation is available at rnaglib.org.
We host RNAs annotated with molecule, base pair, and nucleotide level attributes. These include, but are not limited to:
- Secondary structure and 3D coordinates
- Leontis-Westhof base pair geometry classification
- Protein binding, small molecule binding, chemical modifications...
To install the tool, follow the steps in INSTALL.md.
What can you do with rnaglib?
A quickstart and tutorials are available in our online documentation: rnaglib.org.
In this readme we briefly review the functionality of rnaglib:
Benchmark ML models on RNA 3D structures (new)
We now provide datasets of RNA 3D structures ready-to-use for machine learning model benchmarking in seven
biologically relevant tasks.
Moreover, we provide many tools to create your own new tasks.
A more detailed description is provided in the Tasks' README and in the
documentation.
Everything you need to train and evaluate a model is built on 3 basic ingredients:
- A
rnaglib.Task object with holds all the relevant data, splits and functionality.
- A
rnaglib.Representation object which converts raw RNAs to tensor formats.
- A model of your choosing, though we provide a basic one to get started
rnaglib.learning.PyGmodel
from rnaglib.tasks import ChemicalModification
from rnaglib.transforms import GraphRepresentation
from rnaglib.learning.task_models import PygModel
task = ChemicalModification(root="my_root")
model = PygModel.from_task(task)
pyg_rep = GraphRepresentation(framework="pyg")
task.add_representation(pyg_rep)
train_loader, val_loader, test_loader = task.get_split_loaders(batch_size=8)
for batch in train_loader:
batch = batch['graph'].to(model.device)
output = model(batch)
test_metrics = model.evaluate(task, split='test')
Get annotated RNA 3D structures
Fetch and browse annotated RNA 3D structures
Current release contains annotations generated by x3dna-dssr as well as some additional ones that we added for all
available PDBs at the time of release.
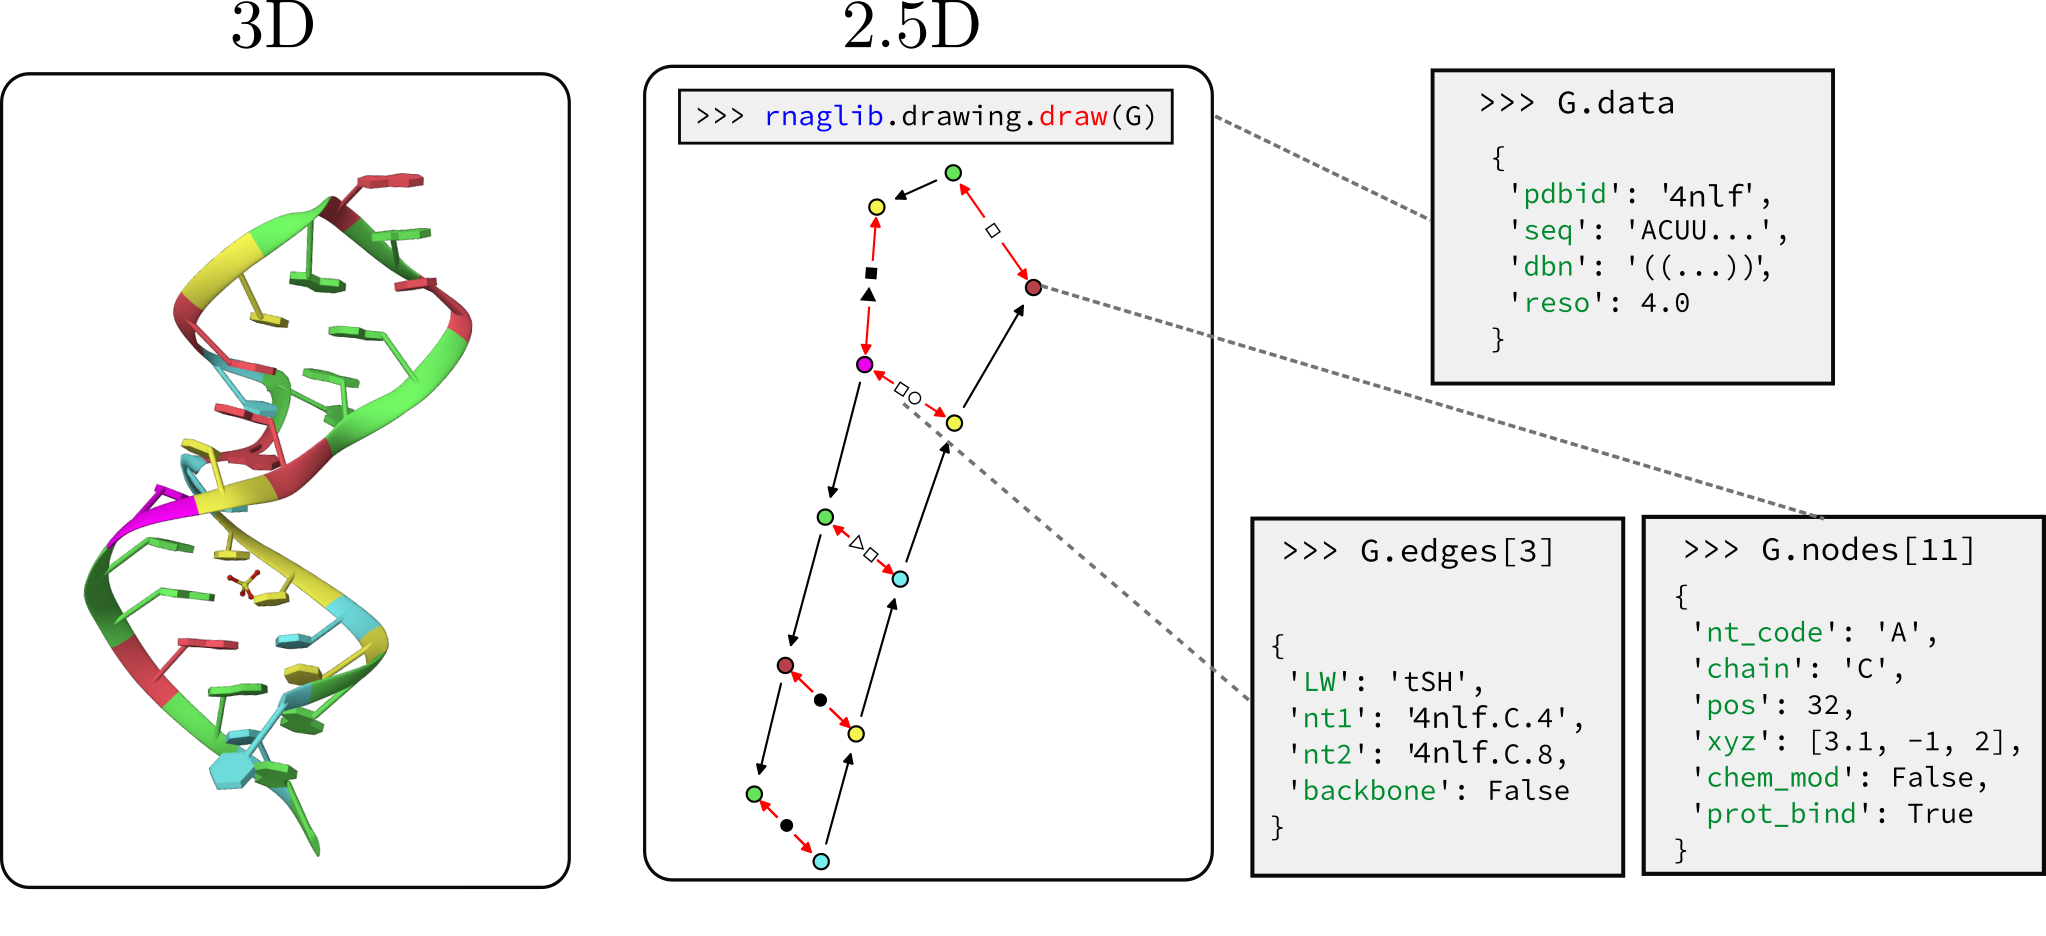
Each RNA is stored as a networkx graph where nodes are residues and edges are backbone and base pairing edges.
The networkx graph object has graph-level, node-level and edge-level attributes.
Here is a reference for all the annotations currently
available.
>>> from rnaglib.dataset import rna_from_pdbid
>>> rna_dict = rna_from_pdbid('1fmn')
>>> rna_dict['rna'].graph
{'name': '1fmn', 'pdbid': '1fmn', 'ligand_to_smiles': {'FMN': 'Cc1cc2c(cc1C)N(C3=NC(=O)NC(=O)C3=N2)CC(C(C(COP(=O)(O)O)O)O)O'}, 'ss': {'A': '..(((((......(((....))).....)))))..'}, 'seq': {'A': 'GGCGUGUAGGAUAUGCUUCGGCAGAAGGACACGCC'}}
Dowloading whole RNA structure databases
In addition to analysing RNA data, RNAglib also distributes available parsed RNA structures.
Databases of annotated structures can be downloaded directly from Zenodo.
| 2.0.2 | 25-02-25 | 8441 | 2921 | 3.375 | ac303c7 |
| 2.0.0 | 12-01-25 | 8305 | 2877 | 3.369 | 33a9e989 |
| 1.0.0 | 15-02-23 | 5759 | 1176 | 3.269 | 5446ae2c |
| 0.0.0 | 20-07-21 | 3739 | 899 | 3.186 | eb25dabd |
They can also be obtained through the provided command line utility, where you can specify the version and redundancy.
$ rnaglib_download -r all|nr
Annotate your own structures
You can extract Leontis-Westhof interactions and convert 3D structures to 2.5D graphs.
We wrap a fork of fr3d-python to support this functionality.
from rnaglib.prepare_data import fr3d_to_graph

G = fr3d_to_graph("../data/structures/1fmn.cif")
Warning: this method currently does not support non-standard residues. Support coming soon. Up to version 1.0.0 of the
RNA database were created using x3dna-dssr which do contain non-standard residues.
Additional functionalities
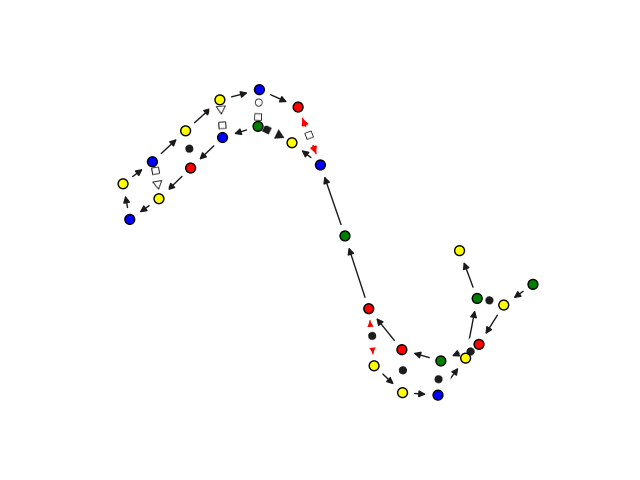
Quick visualization of 2.5D graphs
We customize networkx graph drawing functionalities to give some convenient visualization of 2.5D base pairing networks.
This is not a dedicated visualization tool, it is only intended for quick debugging. We point you
to VARNAhttps://varna.lisn.upsaclay.fr/ or RNAscape for a
full-featured visualizer.
from rnaglib.drawing import rna_draw

rna_draw(G, show=True, layout="spring")
2.5D graph comparison and alignment
When dealing with 3D structures as 2.5D graphs we support graph-level comparison through the graph edit distance.
from rnaglib.algorithms import graph_edit_distance
from rnaglib.dataset import rna_from_pdbid
G = rna_from_pdbid("4nlf")["rna"]
print(graph_edit_distance(G, G))
Citation
@article{mallet2022rnaglib,
  title={RNAglib: a python package for RNA 2.5 D graphs},
  author={Mallet, Vincent and Oliver, Carlos and Broadbent, Jonathan and Hamilton, William L and Waldisp{\"u}hl, J{\'e}r{\^o}me},
  journal={Bioinformatics},
  volume={38},
  number={5},
  pages={1458--1459},
  year={2022},
  publisher={Oxford University Press}
}
Around RNAglib
Projects using rnaglib
If you use rnaglib in one of your projects, please cite and feel free to make a pull request so we can list your project
here.
Resources
References
- Leontis, N. B., & Zirbel, C. L. (2012). Nonredundant 3D Structure Datasets for RNA Knowledge Extraction and
Benchmarking. In RNA 3D Structure Analysis and Prediction N. Leontis & E. Westhof (Eds.), (Vol. 27, pp. 281–298).
Springer Berlin Heidelberg. doi:10.1007/978-3-642-25740-7_13