Product
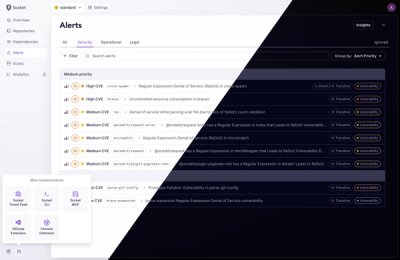
A Fresh Look for the Socket Dashboard
We’ve redesigned the Socket dashboard with simpler navigation, less visual clutter, and a cleaner UI that highlights what really matters.
By André Staltz, Jeppe Hasseriis, Nolan Lawson - Jun 23, 2025
[[file:https://travis-ci.org/jdoepfert/roipoly.py.svg?branch=master]]
Small python module to select a polygonal region of interest (ROI) in an image that is stored as a numpy array. The usage is similar to the [[https://mathworks.com/help/images/ref/roipoly.html][roipoly]] function present in the image processing toolbox from MATLAB.
[[file:/img/ROIs.PNG]]
** Installation
Either from PyPi: pip install roipoly
Or get the latest version from github: pip install git+https://github.com/jdoepfert/roipoly.py
** Running the examples
Basic usage: #+begin_SRC shell python examples/basic_example.py #+end_SRC
Drawing multiple ROIs: #+begin_SRC shell python examples/multi_roi_example.py #+end_SRC
** Usage *** Creating a ROI In your python code, import the roipoly module using #+begin_SRC python from roipoly import RoiPoly #+end_SRC To draw a ROI within an image present as a numpy array, show it first using e.g. pylabs's =imshow=: #+begin_SRC python from matplotlib import pyplot as plt plt.imshow(image) #+end_SRC Then let the user draw a polygonal ROI within that image: #+begin_SRC python my_roi = RoiPoly(color='r') # draw new ROI in red color #+end_SRC This lets the user interactively draw a polygon within the image by clicking with the left mouse button to select the vertices of the polygon. To close the polygon, click with the right mouse button. After finishing the ROI, the current figure is closed so that the execution of the code can continue.
*** Displaying a ROI To display a created ROI within an image, first display the image as described above using e.g. =imshow=. Then, #+begin_SRC python my_roi.display_roi() #+end_SRC shows the created ROI on top of this image.
Display multiple ROIs like so: #+begin_SRC python for r in [my_roi1, my_roi2, my_roi3] r.display_roi() #+end_SRC
To additionally show the mean pixel grey value inside a ROI in the image, type #+begin_SRC python my_roi.display_mean(image) #+end_SRC
*** Extracting a binary mask image The function =get_mask(image)= creates a binary mask for a certain ROI instance, that is, a 2D numpy array of the size of the image array, whose elements are =True= if they lie inside the ROI polygon, and =False= otherwise. #+begin_SRC python mask = my_roi.get_mask(image) plt.imshow(mask) # show the binary signal mask #+end_SRC
This mask image can be used to e.g. calculate the mean pixel intensity in an image over that ROI: #+begin_SRC python mean = plt.mean(image[mask]) #+end_SRC
*** Drawing multiple ROIs See =examples/multi_roi_example.py=
** Credits Based on a code snippet originally posted [[http://matplotlib.1069221.n5.nabble.com/How-to-draw-a-region-of-interest-td4972.html][here]] by Daniel Kornhauser.
FAQs
Tool to draw regions of interest (ROIs)
We found that roipoly demonstrated a healthy version release cadence and project activity because the last version was released less than a year ago. It has 1 open source maintainer collaborating on the project.
Did you know?

Socket for GitHub automatically highlights issues in each pull request and monitors the health of all your open source dependencies. Discover the contents of your packages and block harmful activity before you install or update your dependencies.
Product
We’ve redesigned the Socket dashboard with simpler navigation, less visual clutter, and a cleaner UI that highlights what really matters.

Industry Insights
Terry O’Daniel, Head of Security at Amplitude, shares insights on building high-impact security teams, aligning with engineering, and why AI gives defenders a fighting chance.

Security News
MCP spec updated with structured tool output, stronger OAuth 2.1 security, resource indicators, and protocol cleanups for safer, more reliable AI workflows.